VMware 3v0-41-22 practice test
Advanced Deploy VMware NSX-T Data Center 3.x
Question 1
SIMULATION
Task 1
You are asked to prepare a VMware NSX-T Data Center ESXi compute cluster Infrastructure. You will
prepare two ESXi servers in a cluster for NSX-T overlay and VLAN use.
All configuration should be done using the NSX UI.
• NOTE: The configuration details in this task may not be presented to you in the order in which you
must complete them.
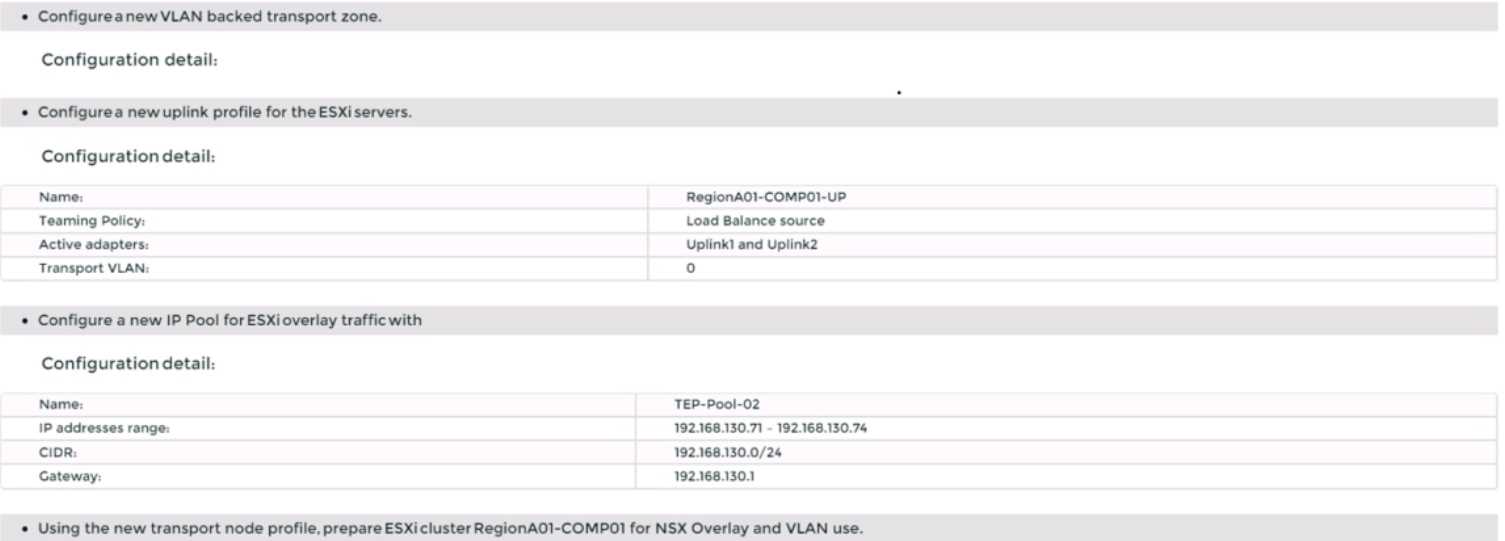
• Configure a new Transport Node profile and add one n-VDS switch. Ensure Uplink 1 and Uplink 2 of
your configuration use vmnic2 and vmnic3 on the host.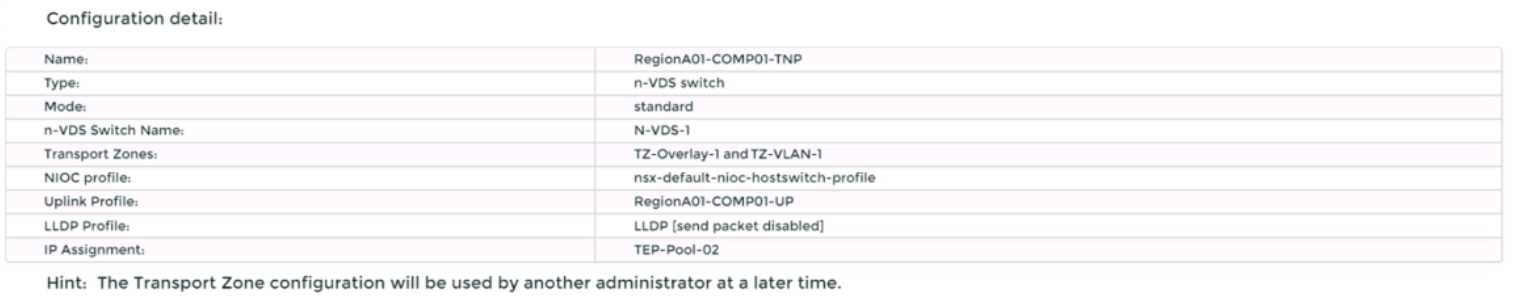
Complete the requested task.
NOTE: Passwords are contained in the user_readme.txt. Configuration details may not be provided in
the correct sequential order. Steps to complete this task must be completed in the proper order.
Other tasks are dependent on the completion Of this task. You may want to move to other
tasks/steps while waiting for configuration changes to be applied. This task should take
approximately 20 minutes to complete.
Answer:
See the
Explanation part of
the Complete
Solution and step by
step instructions.
Explanation:
To prepare a VMware NSX-T Data Center ESXi compute cluster infrastructure, you need to follow
these steps:
Log in to the NSX Manager UI with admin credentials. The default URL is https://<nsx-manager-ip-
address>.
Navigate to System > Fabric > Profiles > Transport Node Profiles and click Add Profile.
Enter a name and an optional description for the transport node profile.
In the Host Switches section, click Set and select N-VDS as the host switch type.
Enter a name for the N-VDS switch and select the mode as Standard or Enhanced Datapath,
depending on your requirements.
Select the transport zones that you want to associate with the N-VDS switch. You can select one
overlay transport zone and one or more VLAN transport zones.
Select an uplink profile from the drop-down menu or create a custom one by clicking New Uplink
Profile.
In the IP Assignment section, select Use IP Pool and choose an existing IP pool from the drop-down
menu or create a new one by clicking New IP Pool.
In the Physical NICs section, map the uplinks to the physical NICs on the host. For example, map
Uplink 1 to vmnic2 and Uplink 2 to vmnic3.
Click Apply and then click Save to create the transport node profile.
Navigate to System > Fabric > Nodes > Host Transport Nodes and click Add Host Transport Node.
Select vCenter Server as the compute manager and select the cluster that contains the two ESXi
servers that you want to prepare for NSX-T overlay and VLAN use.
Select the transport node profile that you created in the previous steps and click Next.
Review the configuration summary and click Finish to start the preparation process.
The preparation process may take some time to complete. You can monitor the progress and status
of the host transport nodes on the Host Transport Nodes page. Once the preparation is complete,
you will see two host transport nodes with a green status icon and a Connected state.
You have
successfully prepared a VMware NSX-T Data Center ESXi compute cluster infrastructure using a
transport node profile.
Question 2
SIMULATION
Task 2
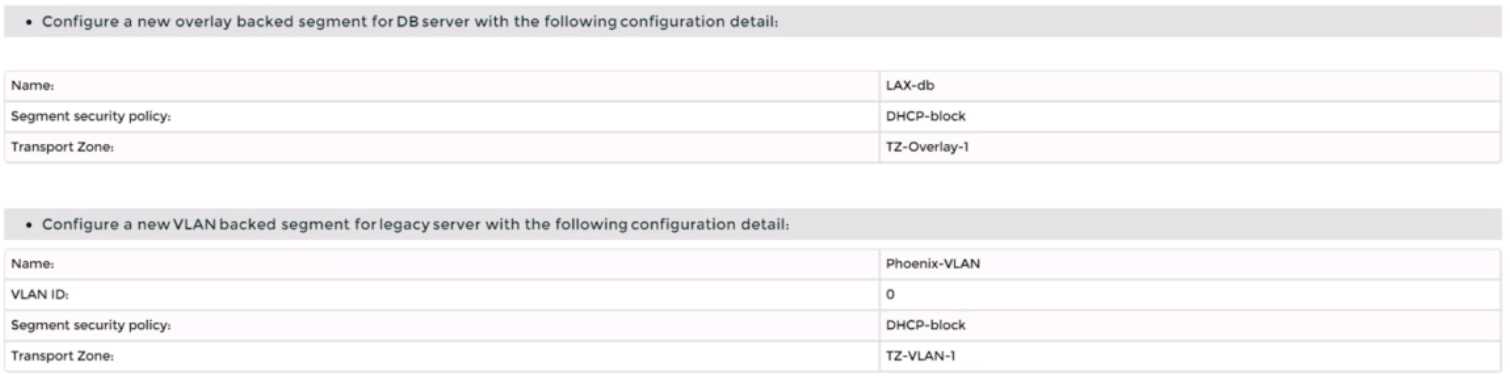
You are asked to deploy three Layer 2 overlay-backed segments to support a new 3-tier app and one
Layer 2 VLAN-backed segment for support of a legacy application. The logical segments must block
Server DHCP requests. Ensure three new overlay-backed segments and one new VLAN-backed logical
segment are deployed to the RegionA01-COPMOI compute cluster. All configuration should be done
utilizing the NSX UI.
You need to: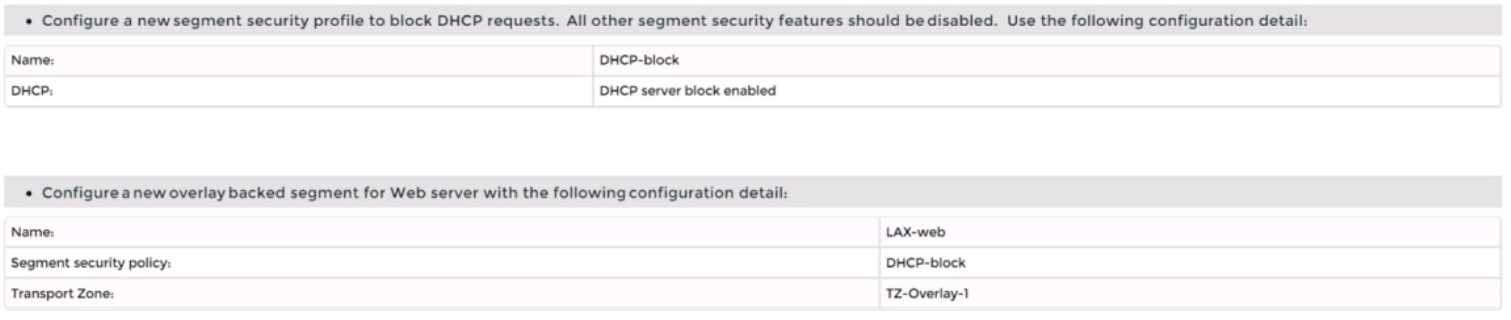
Complete the requested task.
Notes: Passwords are contained in the user_readme.txt. Task 2 is dependent on the completion of
Task 1. Other tasks are dependent on completion of this task. You may want to move to the next tasks
while waiting for configuration changes to be applied. This task should take approximately 10
minutes to complete.
Answer:
See the
Explanation part of
the Complete
Solution and step by
step instructions.
Explanation:
To deploy three layer 2 overlay-backed segments and one layer 2 VLAN-backed segment, you need to
follow these steps:
Log in to the NSX Manager UI with admin credentials. The default URL is https://<nsx-manager-ip-
address>.
Navigate to Networking > Segments and click Add Segment.
Enter a name for the segment, such as Web-01.
Select Tier-1 as the connectivity option and choose an existing tier-1 gateway from the drop-down
menu or create a new one by clicking New Tier-1 Gateway.
Enter the gateway IP address of the subnet in a CIDR format, such as 192.168.10.1/24.
Select an overlay transport zone from the drop-down menu, such as Overlay-TZ.
Optionally, you can configure advanced settings such as DHCP, Metadata Proxy, MAC Discovery, or
QoS for the segment by clicking Set Advanced Configs.
Click Save to create the segment.
Repeat steps 2 to 8 for the other two overlay-backed segments, such as App-01 and DB-01, with
different subnet addresses, such as 192.168.20.1/24 and 192.168.30.1/24.
To create a VLAN-backed segment, click Add Segment again and enter a name for the segment, such
as Legacy-01.
Select Tier-0 as the connectivity option and choose an existing tier-0 gateway from the drop-down
menu or create a new one by clicking New Tier-0 Gateway.
Enter the gateway IP address of the subnet in a CIDR format, such as 10.10.10.1/24.
Select a VLAN transport zone from the drop-down menu, such as VLAN-TZ, and enter the VLAN ID for
the segment, such as 100.
Optionally, you can configure advanced settings such as DHCP, Metadata Proxy, MAC Discovery, or
QoS for the segment by clicking Set Advanced Configs.
Click Save to create the segment.
To apply a segment security profile to block DHCP requests on the segments, navigate to Networking
> Segments > Segment Profiles and click Add Segment Profile.
Select Segment Security as the profile type and enter a name and an optional description for the
profile.
Toggle the Server Block and Server Block - IPv6 buttons to enable DHCP filtering for both IPv4 and
IPv6 traffic on the segments that use this profile.
Click Save to create the profile.
Navigate to Networking > Segments and select the segments that you want to apply the profile to.
Click Actions > Apply Profile and select the segment security profile that you created in step 18.
Click Apply to apply the profile to the selected segments.
You have successfully deployed three layer 2 overlay-backed segments and one layer 2 VLAN-backed
segment with DHCP filtering using NSX-T Manager UI.
Question 3
SIMULATION
Task 3
You are asked to deploy a new instance of NSX-T into an environment with two isolated tenants.
These tenants each have separate physical data center cores and have standardized on BCP as a
routing protocol.
You need to:
Complete the requested task.
Notes: Passwords are Contained in the user_readme.txt. Task 3 is dependent on the Completion Of
Task and 2. Other tasks are dependent On the Completion Of this task. Do not wait for configuration
changes to be applied in this task as processing may take up to 10 minutes to complete. Check back
on completion. This task should take approximately 10 minutes to complete.
Answer:
See the
Explanation part of
the Complete
Solution and step by
step instructions.
Explanation:
To deploy a new instance of NSX-T into an environment with two isolated tenants, you need to follow
these steps:
Log in to the NSX Manager UI with admin credentials. The default URL is https://<nsx-manager-ip-
address>.
Navigate to System > Fabric > Nodes > Edge Transport Nodes and click Add Edge VM.
Enter a name and an optional description for the edge VM. Select the compute manager, cluster, and
resource pool where you want to deploy the edge VM. Click Next.
Select the deployment size and form factor for the edge VM. For this task, you can select Medium as
the size and VM as the form factor. Click Next.
Select the datastore and folder where you want to store the edge VM files. Click Next.
Configure the management network settings for the edge VM. Enter a hostname, a management IP
address, a default gateway, a DNS server, and a domain search list. Optionally, you can enable SSH
and join the edge VM to a domain. Click Next.
Configure the transport network settings for the edge VM. Select an N-VDS as the host switch type
and enter a name for it. Select an uplink profile from the drop-down menu or create a new one by
clicking New Uplink Profile. Map the uplinks to the physical NICs on the edge VM. For example, map
Uplink 1 to fp-eth0 and Uplink 2 to fp-eth1. Optionally, you can configure IP assignment, MTU, or
LLDP for the uplinks. Click Next.
Review the configuration summary and click Finish to deploy the edge VM.
Repeat steps 2 to 8 to deploy another edge VM for redundancy.
Navigate to Networking > Tier-0 Gateway and click Add Gateway > VRF.
Enter a name and an optional description for the VRF gateway. Select an existing tier-0 gateway as
the parent gateway or create a new one by clicking New Tier-0 Gateway.
Click VRF Settings and enter a VRF ID for the tenant. Optionally, you can enable EVPN settings if you
want to use EVPN as the control plane protocol for VXLAN overlay networks.
Click Save to create the VRF gateway.
Repeat steps 10 to 13 to create another VRF gateway for the second tenant with a different VRF ID.
Navigate to Networking > Segments and click Add Segment.
Enter a name and an optional description for the segment. Select VLAN as the connectivity option
and enter a VLAN ID for the segment. For example, enter 128 for Tenant A’s first uplink VLAN
segment.
Select an existing transport zone from the drop-down menu or create a new one by clicking New
Transport Zone.
Click Save to create the segment.
Repeat steps 15 to 18 to create three more segments for Tenant A’s second uplink VLAN segment
(VLAN ID 129) and Tenant B’s uplink VLAN segments (VLAN ID 158 and 159).
Navigate to Networking > Tier-0 Gateway and select the VRF gateway that you created for Tenant A.
Click Interfaces > Set > Add Interface.
Enter a name and an optional description for the interface.
Enter the IP address and mask for the external interface in CIDR format, such as 10.10.10.1/24.
In Type, select External.
In Connected To (Segment), select the VLAN segment that you created for Tenant A’s first uplink
VLAN segment (VLAN ID 128).
Select an edge node where you want to attach the interface, such as Edge-01.
Enter the Access VLAN ID from the list as configured for the segment, such as 128.
Click Save and then Close.
Repeat steps 21 to 28 to create another interface for Tenant A’s second uplink VLAN segment (VLAN
ID 129) on another edge node, such as Edge-02.
Repeat steps 20 to 29 to create two interfaces for Tenant B’s uplink VLAN segments (VLAN ID 158 and
159) on each edge node using their respective VRF gateway and IP addresses.
Configure BGP on each VRF gateway using NSX UI or CLI commands12
.
You need to specify the local
AS number, remote AS number, BGP neighbors, route redistribution, route filters, timers,
authentication, graceful restart, etc., according to your requirements34
.
Configure BGP on each physical router using their respective CLI commands56
.
You need to specify
similar parameters as in step 31 and ensure that they match with their corresponding VRF gateway
settings78
.
Verify that BGP sessions are established between each VRF gateway and its physical router neighbors
using NSX UI or CLI commands . You can also check the routing tables and BGP statistics on each
device .
You have successfully deployed a new instance of NSX-T into an environment with two isolated
tenants using VRF Lite and BGP.
Question 4
SIMULATION
Task 4
You are tasked with creating a logical load balancer for several web servers that were recently
deployed.
You need to:

Complete the requested task.
Notes:
Passwords are contained in the user_readme.txt. Do not wait for configuration changes to be applied
in this task as processing may take some time to complete. This task should take up to 35 minutes to
complete and is required for subsequent tasks.
Answer:
See the
Explanation part of
the Complete
Solution and step by
step instructions.
Explanation:
To create a logical load balancer for several web servers, you need to follow these steps:
Log in to the NSX Manager UI with admin credentials. The default URL is https://<nsx-manager-ip-
address>.
Navigate to Networking > Load Balancing > Load Balancers and click Add Load Balancer.
Enter a name and an optional description for the load balancer. Select the tier-1 gateway where you
want to attach the load balancer from the drop-down menu or create a new one by clicking New
Tier-1 Gateway. Click Save.
Navigate to Networking > Load Balancing > Application Profiles and click Add Application Profile.
Enter a name and an optional description for the application profile. Select HTTP as the application
type from the drop-down menu. Optionally, you can configure advanced settings such as persistence,
X-Forwarded-For, SSL offloading, etc., for the application profile. Click Save.
Navigate to Networking > Load Balancing > Monitors and click Add Monitor.
Enter a name and an optional description for the monitor. Select HTTP as the protocol from the drop-
down menu. Optionally, you can configure advanced settings such as interval, timeout, fall count, rise
count, etc., for the monitor. Click Save.
Navigate to Networking > Load Balancing > Server Pools and click Add Server Pool.
Enter a name and an optional description for the server pool. Select an existing application profile
from the drop-down menu or create a new one by clicking New Application Profile. Select an existing
monitor from the drop-down menu or create a new one by clicking New Monitor. Optionally, you can
configure advanced settings such as algorithm, SNAT translation mode, TCP multiplexing, etc., for the
server pool. Click Save.
Click Members > Set > Add Member and enter the IP address and port number of each web server
that you want to add to the server pool. For example, enter 192.168.10.10:80 and 192.168.10.11:80
for two web servers listening on port 80. Click Save and then Close.
Navigate to Networking > Load Balancing > Virtual Servers and click Add Virtual Server.
Enter a name and an optional description for the virtual server. Enter the IP address and port number
of the virtual server that will receive the client requests, such as 10.10.10.100:80. Select HTTP as the
service profile from the drop-down menu or create a new one by clicking New Service Profile. Select
an existing server pool from the drop-down menu or create a new one by clicking New Server Pool.
Optionally, you can configure advanced settings such as access log, connection limit, rate limit, etc.,
for the virtual server. Click Save.
You have successfully created a logical load balancer for several web servers using NSX-T Manager
UI.
Question 5
SIMULATION
Task 5
You are asked to configure a micro-segmentation policy for a new 3-tier web application that will be
deployed to the production environment.
You need to:
Notes:
Passwords are contained in the user_readme.txt. Do not wait for configuration changes to be applied
in this task as processing may take some time. The task steps are not dependent on one another.
Subsequent tasks may require completion of this task. This task should take approximately 25
minutes to complete.
Answer:
See the
Explanation part of
the Complete
Solution and step by
step instructions.
Explanation:
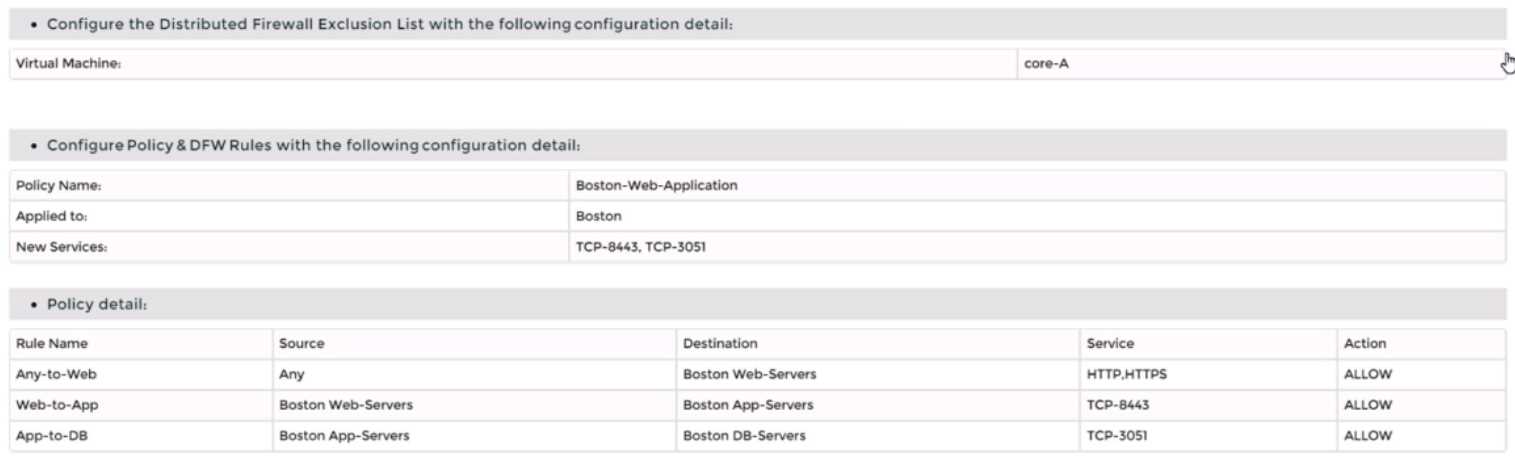
Step-by-Step Guide
Creating Tags and Security Groups
First, log into the NSX-T Manager GUI and navigate to Inventory > Tags to create tags like "BOSTON-
Web" for web servers and assign virtual machines such as BOSTON-web-01a and BOSTON-web-02
a. Repeat for "BOSTON-App" and "BOSTON-DB" with their respective VMs. Then, under Security >
Groups, create security groups (e.g., "BOSTON Web-Servers") based on these tags to organize the
network logically.
Excluding Virtual Machines
Next, go to Security > Distributed Firewall > Exclusion List and add the "core-A" virtual machine to
exclude it from firewall rules, ensuring it operates without distributed firewall restrictions.
Defining Custom Services
Check Security > Services for existing services. If "TCP-9443" and "TCP-3051" are missing, create
them by adding new services with the protocol TCP and respective port numbers to handle specific
application traffic.
Setting Up the Policy and Rules
Create a new policy named "BOSTON-Web-Application" under Security > Distributed Firewall >
Policies. Add rules within this policy:
Allow any source to "BOSTON Web-Servers" for HTTP/HTTPS.
Permit "BOSTON Web-Servers" to "BOSTON App-Servers" on TCP-9443.
Allow "BOSTON App-Servers" to "BOSTON DB-Servers" on TCP-3051. Finally, save and publish the
policy to apply the changes.
This setup ensures secure, segmented traffic for the 3-tier web application, an unexpected detail
being the need to manually create custom services for specific ports, enhancing flexibility.
Survey Note: Detailed Configuration of Micro-Segmentation Policy in VMware NSX-T Data Center 3.x
This note provides a comprehensive guide for configuring a micro-segmentation policy for a 3-tier
web application in VMware NSX-T Data Center 3.x, based on the task requirements. The process
involves creating tags, security groups, excluding specific virtual machines, defining custom services,
and setting up distributed firewall policies. The following sections detail each step, ensuring a
thorough understanding for network administrators and security professionals.
Background and Context
Micro-segmentation in VMware NSX-T Data Center is a network security technique that logically
divides the data center into distinct security segments, down to the individual workload level, using
network virtualization technology. This is particularly crucial for a 3-tier web application, comprising
web, application, and database layers, to control traffic and enhance security. The task specifies
configuring this for a production environment, with notes indicating passwords are in
user_readme.txt and no need to wait for configuration changes, as processing may take time.
Step-by-Step Configuration Process
Step 1: Creating Tags
Tags are used in NSX-T to categorize virtual machines, which can then be grouped for policy
application. The process begins by logging into the NSX-T Manager GUI, accessible via a web browser
with admin privileges. Navigate to Inventory > Tags, and click "Add Tag" to create the following:
Tag name: "BOSTON-Web", assigned to virtual machines BOSTON-web-01a and BOSTON-web-02a.
Tag name: "BOSTON-App", assigned to BOSTON-app-01a.
Tag name: "BOSTON-DB", assigned to BOSTON-db-01a.
This step ensures each tier of the application is tagged for easy identification and grouping, aligning
with the attachment's configuration details.
Step 2: Creating Security Groups
Security groups in NSX-T are logical constructs that define membership based on criteria like tags,
enabling targeted policy application. Under Security > Groups, click "Add Group" to create:
Group name: "BOSTON Web-Servers", with criteria set to include the "BOSTON-Web" tag.
Group name: "BOSTON App-Servers", with criteria set to include the "BOSTON-App" tag.
Group name: "BOSTON DB-Servers", with criteria set to include the "BOSTON-DB" tag.
This step organizes the network into manageable segments, facilitating the application of firewall
rules to specific tiers.
Step 3: Excluding "core-A" VM from Distributed Firewall
The distributed firewall (DFW) in NSX-T monitors east-west traffic between virtual machines.
However, certain VMs, like load balancers or firewalls, may need exclusion to operate without DFW
restrictions. Navigate to Security > Distributed Firewall > Exclusion List, click "Add", select "Virtual
Machine", and choose "core-A". Click "Save" to exclude it, ensuring it bypasses DFW rules, as per the
task's requirement.
Step 4: Defining Custom Services
Firewall rules often require specific services, which may not be predefined. Under Security >
Services, check for existing services "TCP-9443" and "TCP-3051". If absent, create them:
Click "Add Service", name it "TCP-9443", set protocol to TCP, and port to 9443.
Repeat for "TCP-3051", with protocol TCP and port 3051.
This step is crucial for handling application-specific traffic, such as the TCP ports mentioned in the
policy type (TCP-9443, TCP-3051), ensuring the rules can reference these services.
Step 5: Creating the Policy and Rules
The final step involves creating a distributed firewall policy to enforce micro-segmentation. Navigate
to Security > Distributed Firewall > Policies, click "Add Policy", and name it "BOSTON-Web-
Application". Add a section, then create the following rules:
Rule Name: "Any-to-Web"
Source: Any (select "Any" or IP Address 0.0.0.0/0)
Destination: "BOSTON Web-Servers" (select the group)
Service: HTTP/HTTPS (predefined service)
Action: Allow
Rule Name: "Web-to-App"
Source: "BOSTON Web-Servers"
Destination: "BOSTON App-Servers"
Service: TCP-9443 (custom service created earlier)
Action: Allow
Rule Name: "App-to-DB"
Source: "BOSTON App-Servers"
Destination: "BOSTON DB-Servers"
Service: TCP-3051 (custom service created earlier)
Action: Allow
After defining the rules, click "Save" and "Publish" to apply the policy. This ensures traffic flows as
required: any to web servers for HTTP/HTTPS, web to app on TCP-9443, and app to database on TCP-
3051, while maintaining security through segmentation.
Additional Considerations
The task notes indicate no need to wait for configuration changes, as processing may take time, and
steps are not dependent, suggesting immediate progression is acceptable. Passwords are in
user_readme.txt, implying the user has necessary credentials. The policy order is critical, with rules
processed top-to-bottom, and the attachment's "Type: TCP-9443, TCP-3051" likely describes the
services used, not affecting the configuration steps directly.
Table: Summary of Configuration Details
Component
Details
BOSTON-Web (BOSTON-web-01a, BOSTON-web-02a), BOSTON-App (BOSTON-app-01a),
Tags
BOSTON-DB (BOSTON-db-01a)
BOSTON Web-Servers (tag BOSTON-Web), BOSTON App-Servers (tag BOSTON-App),
Security Groups
BOSTON DB-Servers (tag BOSTON-DB)
DFW Exclusion
Virtual Machine: core-A
List
Custom Services TCP-9443 (TCP, port 9443), TCP-3051 (TCP, port 3051)
Policy Name
BOSTON-Web-Application
Any-to-Web (Any to Web-Servers, HTTP/HTTPS, Allow), Web-to-App (Web to App-
Firewall Rules
Servers, TCP-9443, Allow), App-to-DB (App to DB-Servers, TCP-3051, Allow)
This table summarizes the configuration, aiding in verification and documentation.
Unexpected Detail
An unexpected aspect is the need to manually create custom services for TCP-9443 and TCP-3051,
which may not be predefined, highlighting the flexibility of NSX-T for application-specific security
policies.
Conclusion
This detailed process ensures a robust micro-segmentation policy, securing the 3-tier web application
by controlling traffic between tiers and excluding specific VMs from DFW, aligning with best practices
for network security in VMware NSX-T Data Center 3.x.
Question 6
SIMULATION
Task 6
You are asked to integrate NSX manager with LDAP to better control NSX administrators' roles and
responsibilities. Ensure users can manage the NSX environment utilizing Active Directory login
credentials.
You need to:
• Configure NSX Manager LDAP integration to the corp.local domain using the following
configuration detail: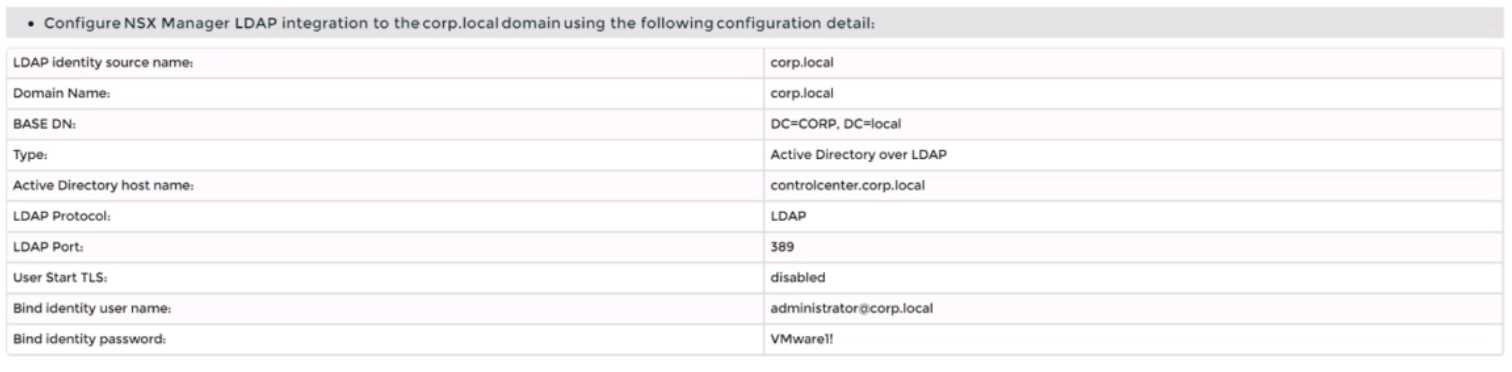
• Configure the user [email protected] Active Directory account as an Enterprise Admin access
role.
Complete the requested task.
Notes:
Passwords are contained in the user_readme.txt. You may want to move to other tasks/steps while
waiting for configuration changes to be applied. This task should take approximately 15 minutes to
complete.
Answer:
See the
Explanation part of
the Complete
Solution and step by
step instructions.
Explanation:
To integrate NSX Manager with LDAP to better control NSX administrators’ roles and responsibilities,
you need to follow these steps:
Log in to the NSX Manager UI with admin credentials. The default URL is https://<nsx-manager-ip-
address>.
Navigate to System > User Management > LDAP and click Add Identity Source.
Enter a name for the identity source, such as corp.local.
Enter the domain name of your Active Directory server, such as DC=corp,DC=local.
Select Active Directory over LDAP as the type from the drop-down menu.
Click Set to configure LDAP servers. You can add up to three LDAP servers for failover support, to
each domain.
Enter the hostname or IP address of your LDAP server, such as corpdcserver.corp.local.
Select LDAP as the protocol from the drop-down menu.
Enter the port number for the LDAP server, such as 389.
Click Connection Status to test the connection to the LDAP server. If successful, you will see a green
check mark and a message saying “Connection successful”.
Optionally, you can enable StartTLS to use encryption for the LDAP connection. To do this, toggle the
Use StartTLS button and enter the certificate of the LDAP server in PEM format in the text box below.
Click Save to add the LDAP server.
Repeat steps 6 to 12 to add more LDAP servers if needed.
Enter the bind entry user name and password for the LDAP server, such as [email protected]
and VMware1!.
Click Save to create the identity source.
Navigate to System > User Management > Users and Roles and click Add Role Assignment for LDAP.
Select corp.local as the domain from the drop-down menu.
Enter [email protected] in the search box and select it from the list that appears.
Select Enterprise Admin as the role from the drop-down menu.
Click Save to assign the role to the user.
You have successfully integrated NSX Manager with LDAP and configured [email protected]
Active Directory account as an Enterprise Admin access role.
Question 7
SIMULATION
Task 7
you are asked to create a custom QoS profile to prioritize the traffic on the phoenix-VLAN segment
and limit the rate of ingress traffic.
You need to:
• Create a custom QoS profile for the phoenix-VLAN using the following configuration detail: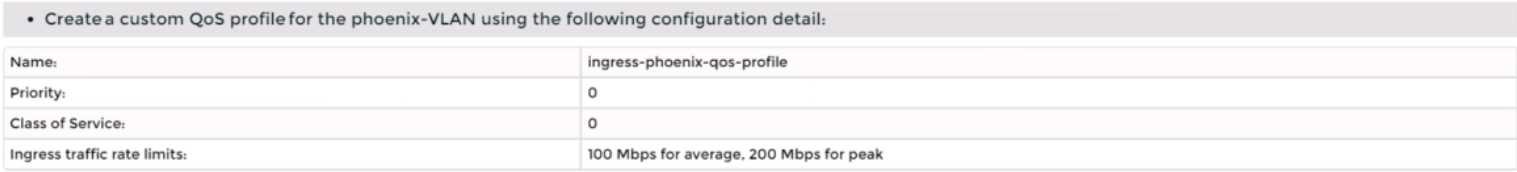
• Apply the profile on the ‘phoenix-VLAN' segment
Complete the requested task.
Notes: Passwords are contained in the user_readme.txt.
take approximately 5 minutes to complete.
Subsequent tasks may require the completion of this task. This task should
Answer:
See the
Explanation part of
the Complete
Solution and step by
step instructions.
Explanation:
To create a custom QoS profile to prioritize the traffic on the phoenix-VLAN segment and limit the
rate of ingress traffic, you need to follow these steps:
Log in to the NSX Manager UI with admin credentials. The default URL is https://<nsx-manager-ip-
address>.
Navigate to Networking > Segments > Switching Profiles and click Add Switching Profile. Select QoS
as the profile type.
Enter a name and an optional description for the QoS profile, such as phoenix-QoS.
In the Mode section, select Untrusted as the mode from the drop-down menu. This will allow you to
set a custom DSCP value for the outbound IP header of the traffic on the segment.
In the Priority section, enter 46 as the DSCP value. This will mark the traffic with Expedited
Forwarding (EF) per-hop behavior, which is typically used for high-priority applications such as voice
or video.
In the Class of Service section, enter 5 as the CoS value. This will map the DSCP value to a CoS value
that can be used by VLAN-based logical ports or physical switches to prioritize the traffic.
In the Ingress section, enter 1000000 as the Average Bandwidth in Kbps. This will limit the rate of
inbound traffic from the VMs to the logical network to 1 Mbps.
Optionally, you can also configure Peak Bandwidth and Burst Size settings for the ingress traffic,
which will allow some burst traffic above the average bandwidth limit for a short duration.
Click Save to create the QoS profile.
Navigate to Networking > Segments and select the phoenix-VLAN segment that you want to apply
the QoS profile to.
Click Actions > Apply Profile and select phoenix-QoS as the switching profile that you want to apply
to the segment.
Click Apply to apply the profile to the segment.
You have successfully created a custom QoS profile and applied it to the phoenix-VLAN segment.
Question 8
SIMULATION
Task 8
You are tasked With troubleshooting the NSX IPSec VPN service Which has been reported down.
Verify the current NSX configuration is deployed and resolve any issues.
You need to:
• Verify the present configuration as provided below: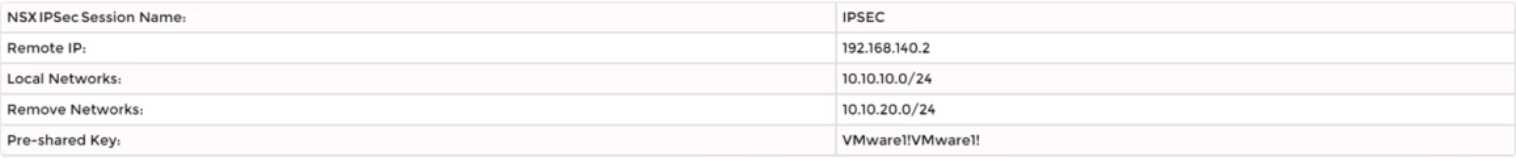
Complete the requested task.
Notes: Passwords are contained in the user_readme.txt. This task is not dependent on another. This
task Should take approximately 15 minutes to complete.
Answer:
See the
Explanation part of
the Complete
Solution and step by
step instructions.
Explanation:
To troubleshoot the NSX IPSec VPN service that has been reported down, you need to follow these
steps:
Log in to the NSX Manager UI with admin credentials. The default URL is https://<nsx-manager-ip-
address>.
Navigate to Networking > VPN > IPSec VPN and select the IPSec VPN session that is down. You can
identify the session by its name, local endpoint, remote endpoint, and status.
Click Show IPSec Statistics and view the details of the IPSec VPN session failure. You can see the error
message, the tunnel state, the IKE and ESP status, and the statistics of the traffic sent and received.
Compare the configuration details of the IPSec VPN session with the expected configuration as
provided below. Check for any discrepancies or errors in the parameters such as local and remote
endpoints, local and remote networks, IKE and ESP profiles, etc.
If you find any configuration errors, click Actions > Edit and modify the parameters accordingly. Click
Save to apply the changes.
If you do not find any configuration errors, check the connectivity and firewall rules between the
local and remote endpoints. You can use ping or traceroute commands from the NSX Edge CLI to test
the connectivity. You can also use show service ipsec command to check the status of IPSec VPN
service on the NSX Edge.
If you find any connectivity or firewall issues, resolve them by adjusting the network settings or
firewall rules on the NSX Edge or the third-party device.
After resolving the issues, verify that the IPSec VPN session is up and running by refreshing the IPSec
VPN page on the NSX Manager UI.
You can also use show service ipsec sp and show service ipsec sa
commands on the NSX Edge CLI to check the status of security policy and security association for the
IPSec VPN session.
Question 9
SIMULATION
Task 9
TO prepare for Virtual machine migration from VLAN-backed port groups to an overlay segment in
NSX. a test bridge has been configured. The bridge
is not functioning, and the -Bridge-VM- is not responding to ICMP requests from the main console.
You need to:
• Troubleshoot the configuration and make necessary changes to restore access to the application.
Complete the requested task.
Notes: Passwords are contained in the user_readme.txt. This task is not dependent on another. This
task should take approximately IS minutes to complete.
Answer:
See the
Explanation part of
the Complete
Solution and step by
step instructions.
Explanation:
To troubleshoot the bridge configuration and restore access to the application, you need to follow
these steps:
Log in to the NSX Manager UI with admin credentials. The default URL is https://<nsx-manager-ip-
address>.
Navigate to Networking > Segments and select the overlay segment that is bridged to the VLAN-
backed port group. For example, select Web-01 segment that you created in Task 2.
Click Bridge > Set and verify the configuration details of the bridge. Check for any discrepancies or
errors in the parameters such as bridge name, bridge ID, VLAN ID, edge node, etc.
If you find any configuration errors, click Edit and modify the parameters accordingly. Click Save to
apply the changes.
If you do not find any configuration errors, check the connectivity and firewall rules between the
overlay segment and the VLAN-backed port group. You can use ping or traceroute commands from
the NSX Edge CLI or the vSphere Web Client to test the connectivity. You can also use show service
bridge command to check the status of the bridge service on the NSX Edge.
If you find any connectivity or firewall issues, resolve them by adjusting the network settings or
firewall rules on the NSX Edge or the vSphere Distributed Switch.
After resolving the issues, verify that the bridge is functioning and the Bridge-VM is responding to
ICMP requests from the main console.
You can also check the MAC addresses learned by the bridge
on both sides of the network using show service bridge mac command on the NSX Edge CLI.
Question 10
SIMULATION
Task 10
You have been notified by the Web Team that they cannot get to any northbound networks from
their Tampa web servers that are deployed on an NSX-T
network segment. The Tampa web VM's however can access each other.
You need to:
• Troubleshoot to find out why the Tampa web servers cannot communicate to any northbound
networks and resolve the issue.
Complete the requested task. TO verify your work. ping the Control Center @ 192.168.110.10
Notes: Passwords are contained in the user_readme.txt. This task is dependent on Task 4. Some exam
candidates may have already completed this task if they had done more than the minimum required
in Task 4. This task should take approximately 15 minutes to complete.
Answer:
See the
Explanation part of
the Complete
Solution and step by
step instructions.
Explanation:
To troubleshoot why the Tampa web servers cannot communicate to any northbound networks, you
need to follow these steps:
Log in to the NSX Manager UI with admin credentials. The default URL is https://<nsx-manager-ip-
address>.
Navigate to Networking > Tier-0 Gateway and select the tier-0 gateway that connects the NSX-T
network segment to the northbound networks. For example, select T0-GW-01.
Click Interfaces > Set and verify the configuration details of the interfaces. Check for any
discrepancies or errors in the parameters such as IP address, subnet mask, MTU, etc.
If you find any configuration errors, click Edit and modify the parameters accordingly. Click Save to
apply the changes.
If you do not find any configuration errors, check the connectivity and firewall rules between the tier-
0 gateway and the northbound networks. You can use ping or traceroute commands from the NSX
Edge CLI or the vSphere Web Client to test the connectivity. You can also use show service router
command to check the status of the routing service on the NSX Edge.
If you find any connectivity or firewall issues, resolve them by adjusting the network settings or
firewall rules on the NSX Edge or the northbound devices.
After resolving the issues, verify that the Tampa web servers can communicate to any northbound
networks by pinging the Control Center @ 192.168.110.10 from one of the web servers.
Question 11
SIMULATION
Task 11
upon testing the newly configured distributed firewall policy for the Boston application. it has been
discovered that the Boston-Web virtual machines can be “pinged" via ICMP from the main console.
Corporate policy does not allow pings to the Boston VMs.
You need to:
• Troubleshoot ICMP traffic and make any necessary changes to the Boston application security
policy.
Complete the requested task.
Notes: Passwords are contained in the user _readme.txt. This task is dependent on Task 5.
Answer:
See the
Explanation part of
the Complete
Solution and step by
step instructions.
Explanation:
To troubleshoot ICMP traffic and make any necessary changes to the Boston application security
policy, you need to follow these steps:
Log in to the NSX Manager UI with admin credentials. The default URL is https://<nsx-manager-ip-
address>.
Navigate to Security > Distributed Firewall and select the firewall policy that applies to the Boston
application. For example, select Boston-web-Application.
Click Show IPSec Statistics and view the details of the firewall rule hits and logs. You can see which
rules are matching the ICMP traffic and which actions are taken by the firewall.
If you find that the ICMP traffic is allowed by a rule that is not intended for it, you can edit the rule
and change the action to Drop or Reject. You can also modify the source, destination, or service
criteria of the rule to make it more specific or exclude the ICMP traffic.
If you find that the ICMP traffic is not matched by any rule, you can create a new rule and specify the
action as Drop or Reject. You can also specify the source, destination, or service criteria of the rule to
match only the ICMP traffic from the main console to the Boston web VMs.
After making the changes, click Publish to apply the firewall policy.
Verify that the ICMP traffic is blocked by pinging the Boston web VMs from the main console again.
You should see a message saying “Request timed out” or “Destination unreachable”.
Question 12
SIMULATION
Task 12
An issue with the Tampa web servers has been reported. You would like to replicate and redirect the
web traffic to a network monitoring tool outside Of the NSX-T environment to further analyze the
traffic.
You are asked to configure traffic replication to the monitoring software for your Tampa web overlay
segments with bi-directional traffic using this detail: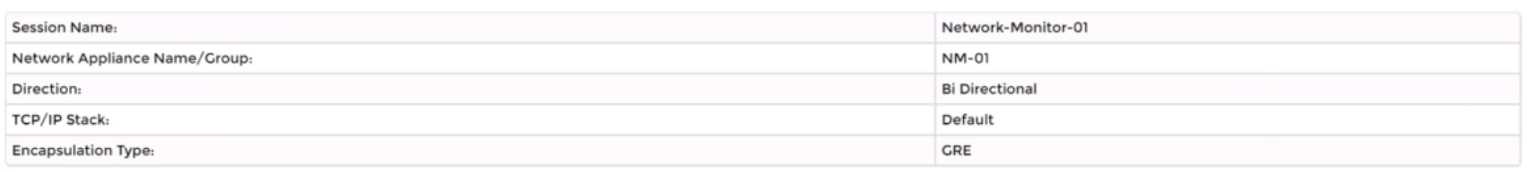
Complete the requested configuration.
Notes: Passwords are contained in the user_readme.txt. This task is not dependent on other tasks.
This task should take approximately 10 minutes to complete.
Answer:
See the
Explanation part of
the Complete
Solution and step by
step instructions.
Explanation:
To configure traffic replication to the monitoring software for your Tampa web overlay segments with
bi-directional traffic, you need to follow these steps:
Log in to the NSX Manager UI with admin credentials. The default URL is https://<nsx-manager-ip-
address>.
Navigate to Networking > Segments and select the Tampa web overlay segment that you want to
replicate the traffic from. For example, select Web-01 segment that you created in Task 2.
Click Port Mirroring > Set > Add Session and enter a name and an optional description for the port
mirroring session. For example, enter Tampa-Web-Monitoring.
In the Direction section, select Bi-directional as the direction from the drop-down menu. This will
replicate both ingress and egress traffic from the source to the destination.
In the Source section, click Set and select the VMs or logical ports that you want to use as the source
of the traffic. For example, select Web-VM-01 and Web-VM-02 as the source VMs. Click Apply.
In the Destination section, click Set and select Remote L3 SPAN as the destination type from the
drop-down menu. This will allow you to replicate the traffic to a remote destination outside of the
NSX-T environment.
Enter the IP address of the destination device where you have installed the network monitoring
software, such as 10.10.10.200.
Select an existing service profile from the drop-down menu or create a new one by clicking New
Service Profile. A service profile defines the encapsulation type and other parameters for the
replicated traffic.
Optionally, you can configure advanced settings such as TCP/IP stack, snap length, etc., for the port
mirroring session.
Click Save and then Close to create the port mirroring session.
You have successfully configured traffic replication to the monitoring software for your Tampa web
overlay segments with bi-directional traffic using NSX-T Manager UI.
Question 13
SIMULATION
Task 13
You have been asked to configure the NSX backups for the environment so that if the NSX Manager
fails it can be restored with the same IP address to the original primary Data Center that is in an
Active / Standby configuration. Backups should be scheduled to run once every 24 hours as well as
when there are changes published to the NSX environment. Ensure that backups are completed on
their respective environment. Verify the backup file has been created on the SFTP server.
• Credentials needed to complete the task:
You need to:
• Verify that an SFTP server is available on the network and obtain SFTP Fingerprint.
• Configure NSX Backups via NSX Appliance Backup
• Configure Scheduling Criteria
Backup Configuration Criteria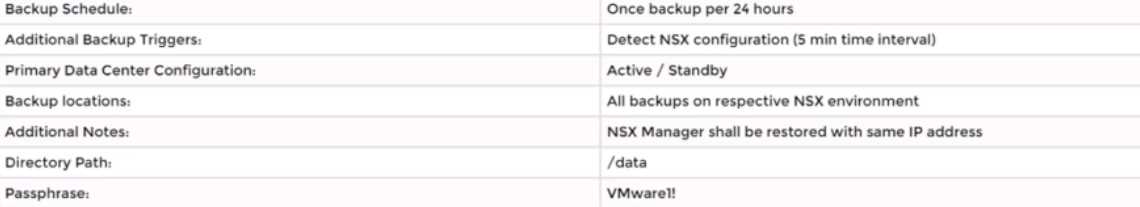
Complete the requested task.
Notes: Passwords are contained in the user_readme.txt. This task is not dependent on other tasks.
This task should take approximately 15 minutes to complete.
Answer:
See the
Explanation part of
the Complete
Solution and step by
step instructions.
Explanation:
To configure the NSX backups for the environment, you need to follow these steps:
Verify that an SFTP server is available on the network and obtain SFTP fingerprint. You can use the
search_web("SFTP server availability") tool to find some information on how to set up and check an
SFTP server. You can also use the ssh-keyscan command to get the fingerprint of the SFTP server. For
example, ssh-keyscan -t ecdsa sftp_server will return the ECDSA key of the sftp_server. You can
compare this key with the one displayed on the NSX Manager UI when you configure the backup
settings.
Configure NSX Backups via NSX Appliance Backup. Log in to the NSX Manager UI with admin
credentials. The default URL is https://<nsx-manager-ip-address>. Select System > Lifecycle
Management > Backup & Restore. Click Edit under the SFTP Server label to configure your SFTP
server. Enter the FQDN or IP address of the backup file server, such as 10.10.10.100. The protocol text
box is already filled in. SFTP is the only supported protocol. Change the default port if necessary. The
default TCP port is 22. In the Directory Path text box, enter the absolute directory path where the
backups will be stored, such as /dat
a. The directory must already exist and cannot be the root directory (/). Avoid using path drive letters
or spaces in directory names; they are not supported. In the Passphrase text box, enter a passphrase
that will be used to encrypt and decrypt the backup files, such as VMware1!. Click Save to create the
backup configuration.
Configure Scheduling Criteria. On the Backup & Restore page, click Edit under the Schedule label to
configure your backup schedule. Select Enabled from the drop-down menu to enable scheduled
backups. Select Daily from the Frequency drop-down menu to run backups once every 24 hours.
Select a time from the Time drop-down menu to specify when the backup will start, such as 12:00
AM. Select Enabled from the Additional Backup Trigger drop-down menu to run backups when there
are changes published to the NSX environment. Click Save to create the backup schedule.
Verify that a backup file has been created on the SFTP server. On the Backup & Restore page, click
Start Backup to run a manual backup and verify that it completes successfully. You should see a
message saying “Backup completed successfully”. You can also check the status and details of your
backups on this page, such as backup size, duration, and timestamp.
Alternatively, you can log in to
your SFTP server and check if there is a backup file in your specified directory path, such as /data.
Question 14
SIMULATION
Task 14
An administrator has seen an abundance of alarms regarding high CPU usage on the NSX Managers.
The administrator has successfully cleared these alarms numerous times in the past and is aware of
the issue. The administrator feels that the number of alarms being produced for these events is
overwhelming the log files.
You need to:
• Review CPU Sensitivity and Threshold values.
Complete the requested task.
Notes: Passwords are contained in the user_readme.txt. This task is not dependent on other tasks.
This task should take approximately 5 minutes to complete.
Answer:
See the
Explanation part of
the Complete
Solution and step by
step instructions.
Explanation:
To review CPU sensitivity and threshold values, you need to follow these steps:
Log in to the NSX Manager UI with admin credentials. The default URL is https://<nsx-manager-ip-
address>.
Navigate to System > Settings > System Settings > CPU and Memory Thresholds.
You will see the current values for CPU and memory thresholds for NSX Manager, NSX Controller, and
NSX Edge. These values determine the percentage of CPU and memory usage that will trigger an
alarm on the NSX Manager UI.
You can modify the default threshold values by clicking Edit and entering new values in the text
boxes. For example, you can increase the CPU threshold for NSX Manager from 80% to 90% to reduce
the number of alarms for high CPU usage. Click Save to apply the changes.
You can also view the historical data for CPU and memory usage for each component by clicking View
Usage History.
You can select a time range and a granularity level to see the usage trends and
patterns over time
Question 15
SIMULATION
Task 15
You have been asked to enable logging so that the global operations team can view inv Realize Log
Insight that their Service Level Agreements are being met for all network traffic that is going in and
out of the NSX environment. This NSX environment is an Active / Active two Data Center design
utilizing N-VDS with BCP. You need to ensure successful logging for the production NSX-T
environment.
You need to:
Verify via putty with SSH that the administrator can connect to all NSX-Transport Nodes. You will use
the credentials identified in Putty (admin).
Verify that there is no current active logging enabled by reviewing that directory is empty -
/var/log/syslog-
Enable NSX Manager Cluster logging
Select multiple configuration choices that could be appropriate success criteria
Enable NSX Edge Node logging
Validate logs are generated on each selected appliance by reviewing the "/var/log/syslog”
Complete the requested task.
Notes: Passwords are contained in the user _ readme.txt. complete.
These task steps are dependent on one another. This task should take approximately 10 minutes to
complete.
Answer:
See the
Explanation part of
the Complete
Solution and step by
step instructions.
Explanation:
To enable logging for the production NSX-T environment, you need to follow these steps:
Verify via putty with SSH that the administrator can connect to all NSX-Transport Nodes. You can use
the credentials identified in Putty (admin) to log in to each transport node. For example, you can use
the following command to connect to the sfo01w01en01 edge transport node: ssh
admin@sfo01w01en01. You should see a welcome message and a prompt to enter commands.
Verify that there is no current active logging enabled by reviewing that directory is empty -
/var/log/syslog-. You can use the ls command to list the files in the /var/log/syslog directory. For
example, you can use the following command to check the sfo01w01en01 edge transport node: ls
/var/log/syslog. You should see an empty output if there is no active logging enabled.
Enable NSX Manager Cluster logging. You can use the search_web("NSX Manager Cluster logging
configuration") tool to find some information on how to configure remote logging for NSX Manager
Cluster. One of the results is
NSX-T Syslog Configuration Revisited - vDives
, which provides the
following steps:
Navigate to System > Fabric > Profiles > Node Profiles then select All NSX Nodes then under Syslog
Servers click +ADD
Enter the IP or FQDN of the syslog server, the Port and Protocol and the desired Log Level then click
ADD
Select multiple configuration choices that could be appropriate success criteri
a. You can use the search_web("NSX-T logging success criteria") tool to find some information on
how to verify and troubleshoot logging for NSX-T. Some of the possible success criteria are:
The syslog server receives log messages from all NSX nodes
The log messages contain relevant information such as timestamp, hostname, facility, severity,
message ID, and message content
The log messages are formatted and filtered according to the configured settings
The log messages are encrypted and authenticated if using secure protocols such as TLS or LI-TLS
Enable NSX Edge Node logging. You can use the search_web("NSX Edge Node logging configuration")
tool to find some information on how to configure remote logging for NSX Edge Node. One of the
results is
Configure Remote Logging - VMware Docs
, which provides the following steps:
Run the following command to configure a log server and the types of messages to send to the log
server. Multiple facilities or message IDs can be specified as a comma delimited list, without spaces.
set logging-server <hostname-or-ip-address [:port]> proto <proto> level <level> [facility <facility>]
[messageid <messageid>] [serverca <filename>] [clientca <filename>] [certificate <filename>] [key
<filename>] [structured-data <structured-data>]
Validate logs are generated on each selected appliance by reviewing the "/var/log/syslog”. You can
use the cat or tail commands to view the contents of the /var/log/syslog file on each appliance. For
example, you can use the following command to view the last 10 lines of the sfo01w01en01 edge
transport node: tail -n 10 /var/log/syslog. You should see log messages similar to this:
2023-04-06T12:34:56+00:00 sfo01w01en01 user.info nsx-edge[1234]: 2023-04-06T12:34:56Z nsx-
edge[1234]: INFO: [nsx@6876 comp="nsx-edge" subcomp="nsx-edge" level="INFO"
security="False"] Message from nsx-edge
You have successfully enabled logging for the production NSX-T environment.