tableau tds-c01 practice test
Tableau Desktop Specialist
Question 1
True or False : Bins can be created on dimensions
- A. False
- B. True
Answer:
B
Explanation:
Bin are a user-defined grouping of numerical data in the data source.
According to the official Tableau documentation: It's sometimes useful to convert a continuous
measure (or a numeric dimension) into bins.
Have a look at the following image. When we right click a measure, we get the following options: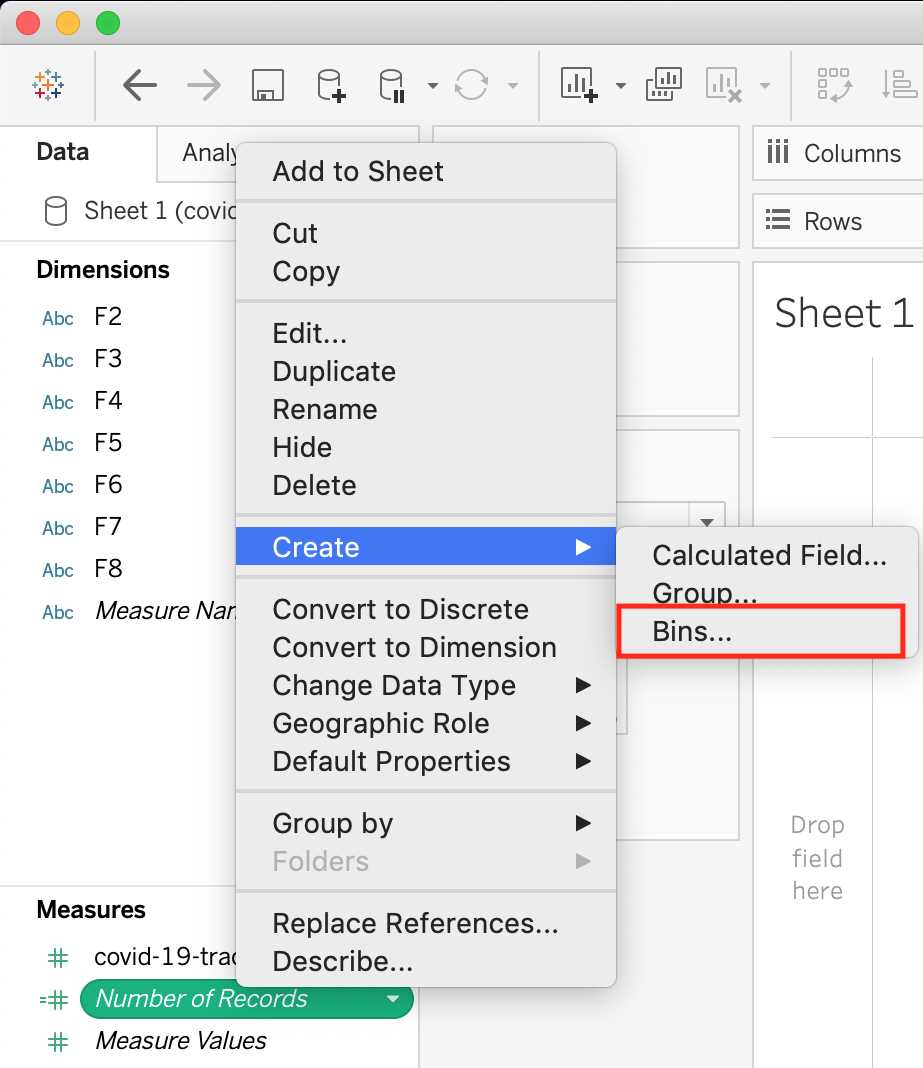
However, for a dimension (this is because the DATA TYPE of this dimension is a string: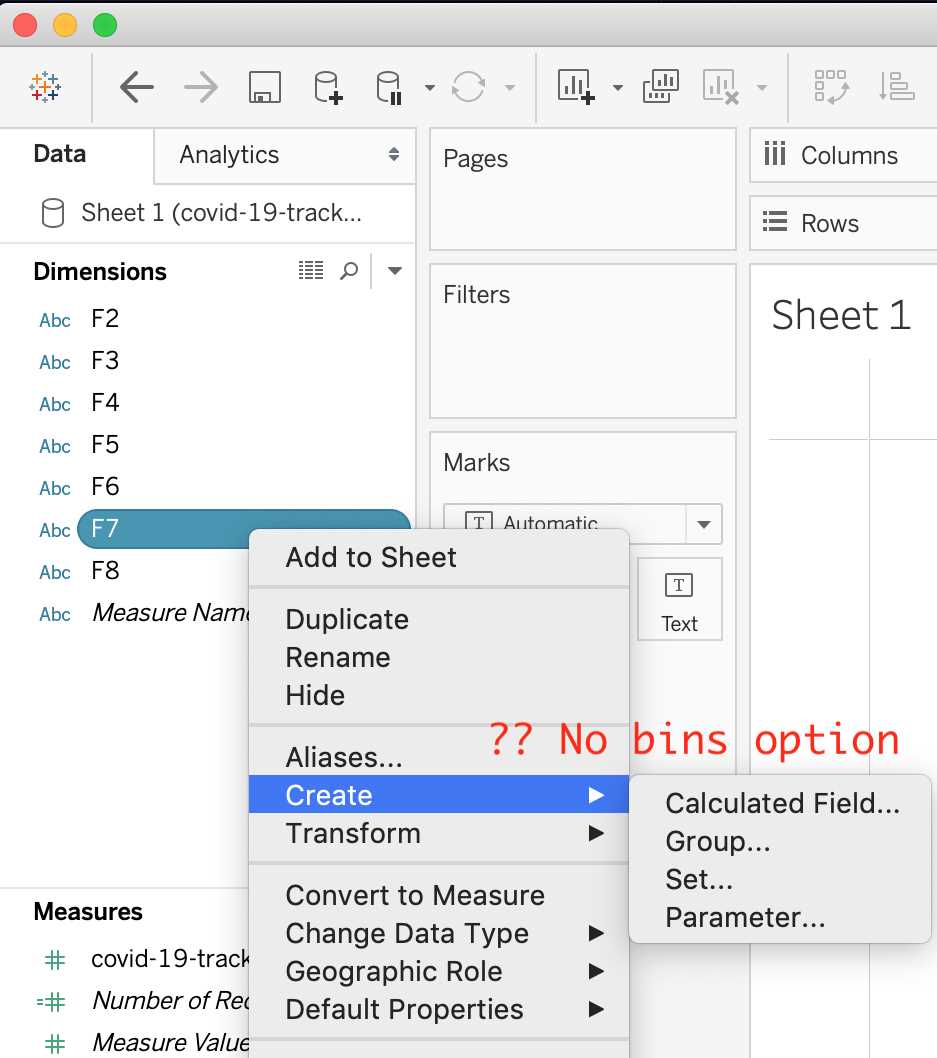
But what if we have a dimension of type NUMBER (NUMERIC DIMENSION)? See below: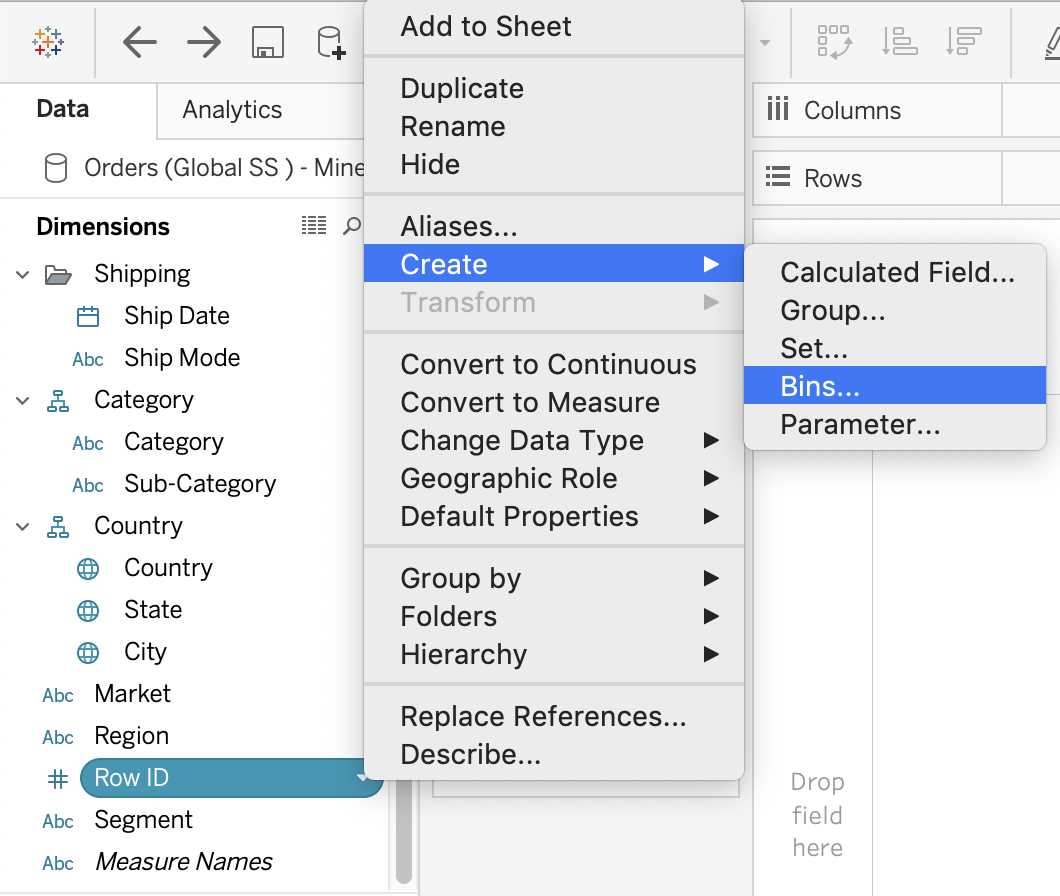
We can clearly create bins from dimensions too - they just have to be numeric :)
For more information, please refer to :
https://help.tableau.com/current/pro/desktop/en-
us/calculations_bins.htm
Question 2
True or False: The Highlighting action can be disabled for the entire workbook.
- A. True
- B. False
Answer:
A
Explanation:
Yes, it is possible to disable highlighting for the entire workbook.
For more information :
https://help.tableau.com/current/pro/desktop/en-gb/actions_highlight.htm
Question 3
Is it possible to use measures in the same view multiple times (e.g. SUM of the measure and AVG of
the measure)?
- A. Yes
- B. No
Answer:
A
Explanation:
Yes, it is very much possible to use measures in the same view multiple times. For example, refer to
the image below: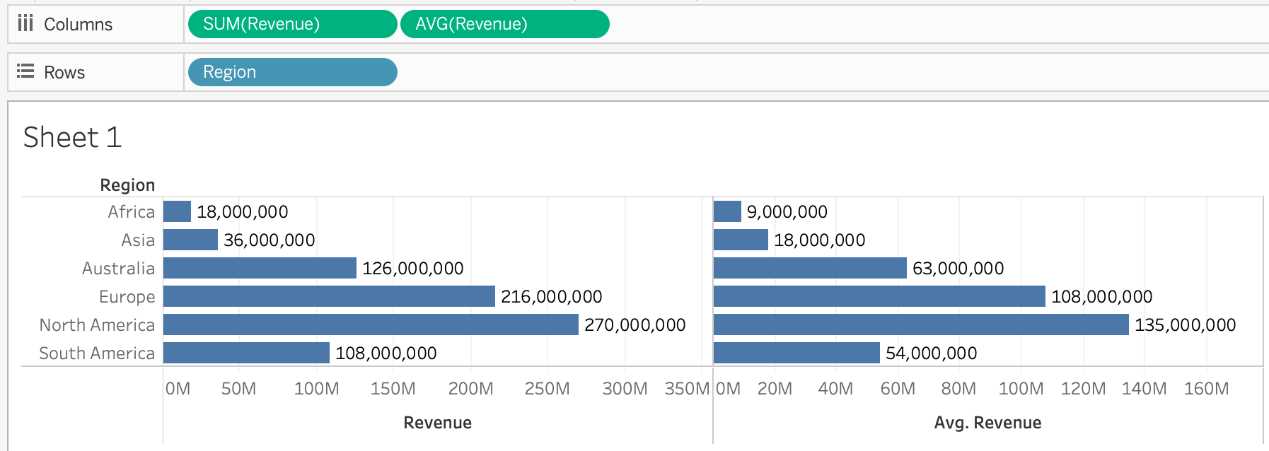
We are using BOTH the Sum of the revenue and the AVG of the revenue in the same view!
Question 4
By definition, Tableau displays measures over time as a ____________
- A. Packed Bubble
- B. Bar
- C. Stacked Bar
- D. Line
Answer:
D
Explanation:
Line charts connect individual data points in a view. They provide a simple way to visualize a
sequence of values and are useful when you want to see trends over time, or to forecast future
values.
Please refer to the images below: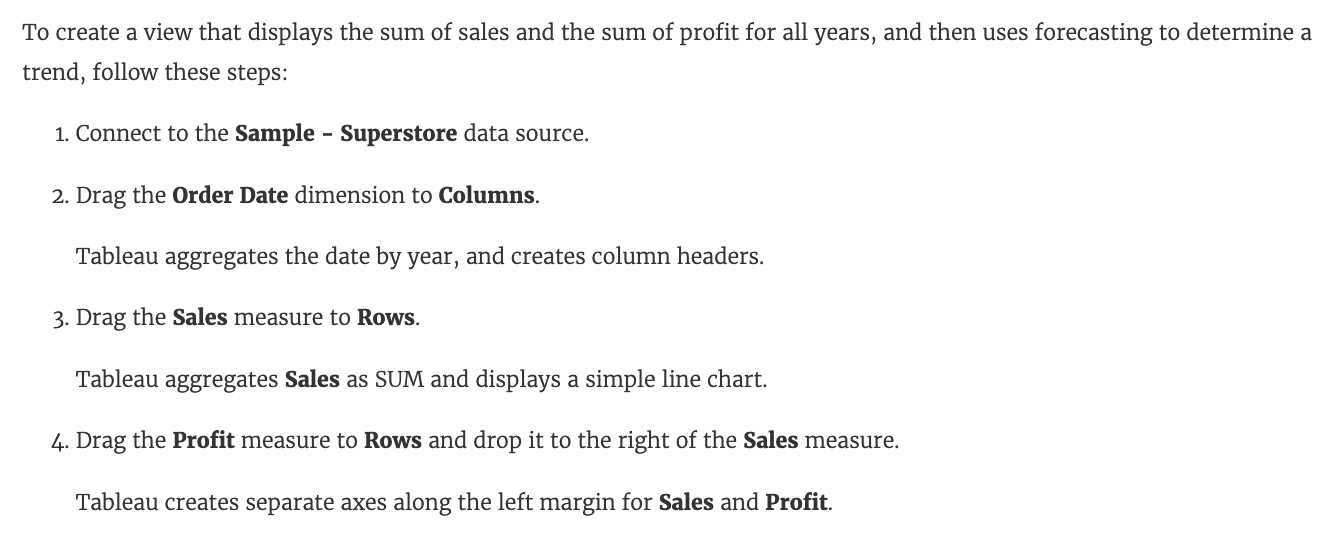
Reference: https://help.tableau.com/current/pro/desktop/en-us/buildexamples_line.htm
Question 5
Which of the following would you use to connect to multiple tables in a single data source at once?
- A. A Blend
- B. A Hierarchy
- C. A Set
- D. A Join
Answer:
D
Explanation:
The data that you analyze in Tableau is often made up of a collection of tables that are related by
specific fields (that is, columns). Joining is a method for combining data on based on those common
fields. The result of combining data using a join is a virtual table that is typically extended
horizontally by adding columns of data.
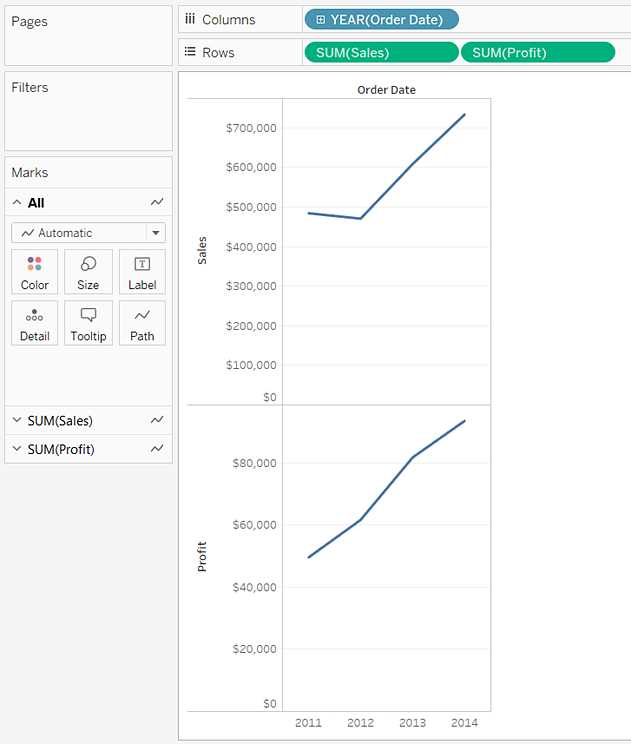
For example, consider the following two tables originating from a single data source:
We can combine these 2 tables, simply by joining the tables on ID to answer questions like, "How
much was paid in royalties for authors from a given publisher?". By combining tables using a join, you
can view and use related data from different tables in your analysis.
Reference:
https://help.tableau.com/current/pro/desktop/en-us/joining_tables.htm
Question 6
What is the minimum amount of RAM recommended for any production use of Tableau Server?
- A. 8GB
- B. 16GB
- C. 32GB
- D. 64GB
Answer:
B
Explanation:
The computer on which you are installing or upgrading Tableau Server must meet the minimum
hardware requirements. If the Setup program determines that your computer does not meet the
following requirements, you will not be able to install Tableau Server.
These minimum requirements are appropriate for a computer that you use for prototyping and
testing of Tableau Server. They apply to single-node installations and to each computer in a
distributed installation.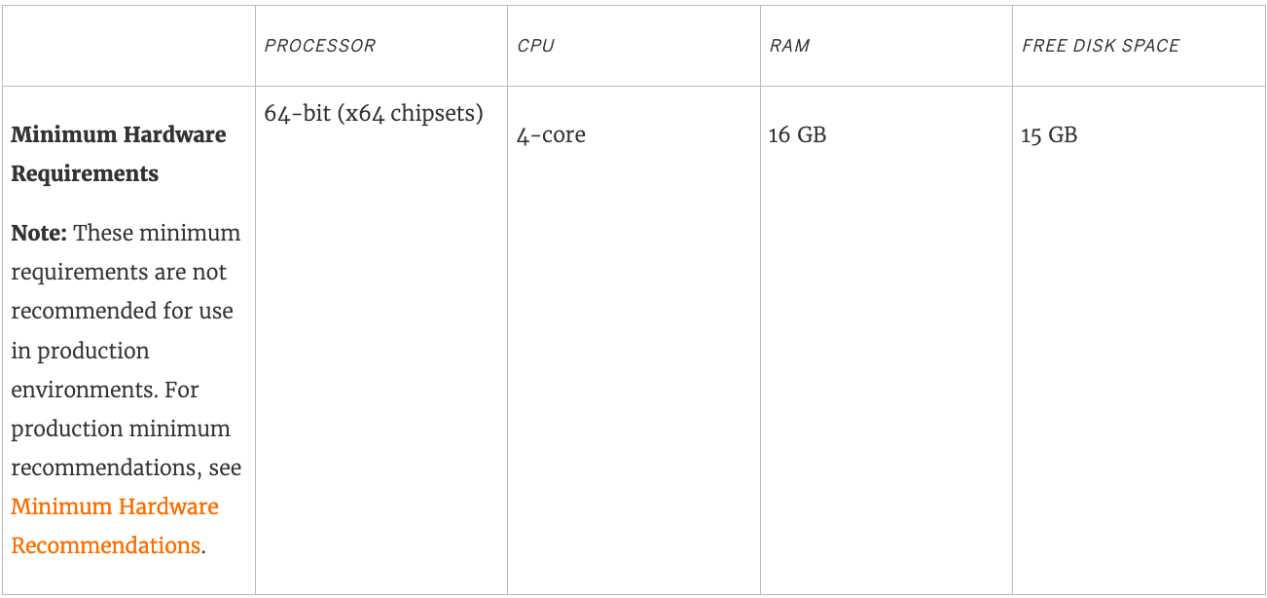
Reference:
https://help.tableau.com/current/server/en-us/server_hardware_min.htm
Question 7
Which of the following chart type makes use of 'binned' data?
- A. Gantt Chart
- B. Bullet chart
- C. Histogram
- D. Treemaps
Answer:
C
Explanation:
A histogram is a chart that displays the shape of a distribution. A histogram looks like a bar chart but
groups values for a continuous measure into ranges, or bins.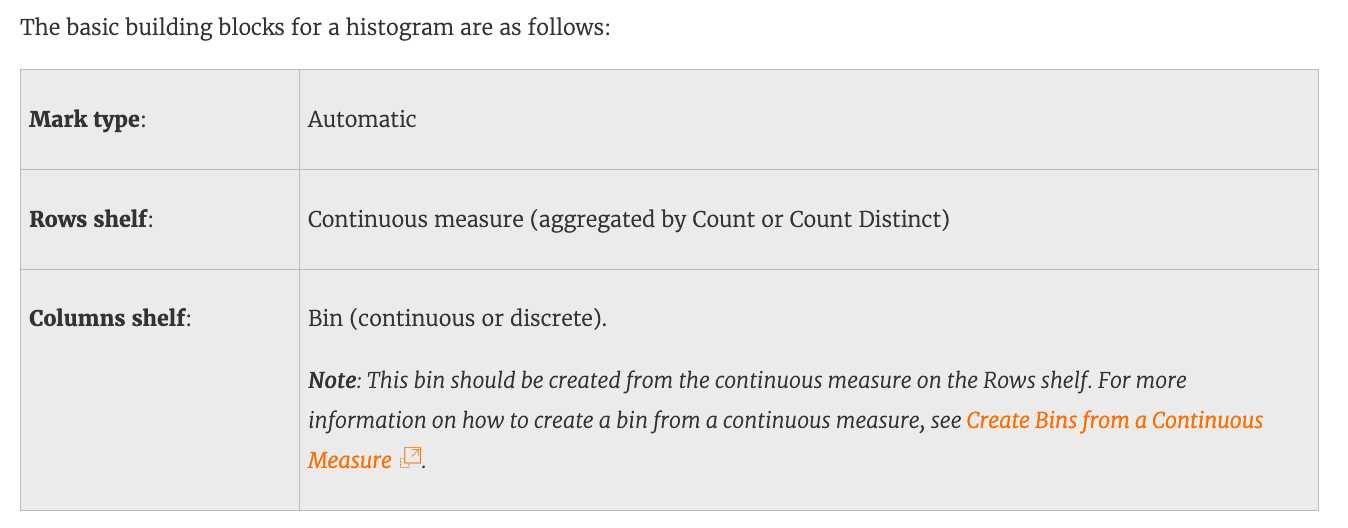
Reference: https://help.tableau.com/current/pro/desktop/en-us/buildexamples_histogram.htm
Question 8
True or False: Trend lines can only be used with numeric or date fields
- A. True
- B. False
Answer:
A
Explanation:
You can show trend lines in a visualization to highlight trends in your data.
To add trend lines to a view, both axes must contain a field that can be interpreted as a number. For
example, you cannot add a trend line to a view that has the Product Category dimension, which
contains strings, on the Columns shelf and the Profit measure on the Rows shelf.
However, you can add a trend line to a view of sales over time because both sales and time can be
interpreted as numeric values.
Reference: https://help.tableau.com/current/pro/desktop/en-us/trendlines_add.htm
Question 9
True or False: All rows from both tables are returned in an INNER JOIN
- A. True
- B. False
Answer:
B
Explanation:
The INNER JOIN keyword selects all rows from both tables as long as there is a match between the
columns. Consider 2 tables "Orders" and "Customers".
If there are records in the "Orders" table that do not have matches in "Customers", these orders will
not be shown!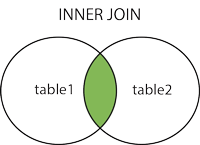
Reference: https://www.w3schools.com/sql/sql_join_inner.asp
Question 10
Is SUM a table calculation?
- A. Yes
- B. No
Answer:
B
Explanation:
SUM is an aggregate function, not a table calculation!
A table calculation is a transformation you apply to the values in a visualization. Table calculations
are a special type of calculated field that computes on the local data in Tableau. They are calculated
based on what is currently in the visualization and do not consider any measures or dimensions that
are filtered out of the visualization.
The most common Table calculations are:
Running Total
Percent Difference
Difference
Percent of Total
Rank
Percentile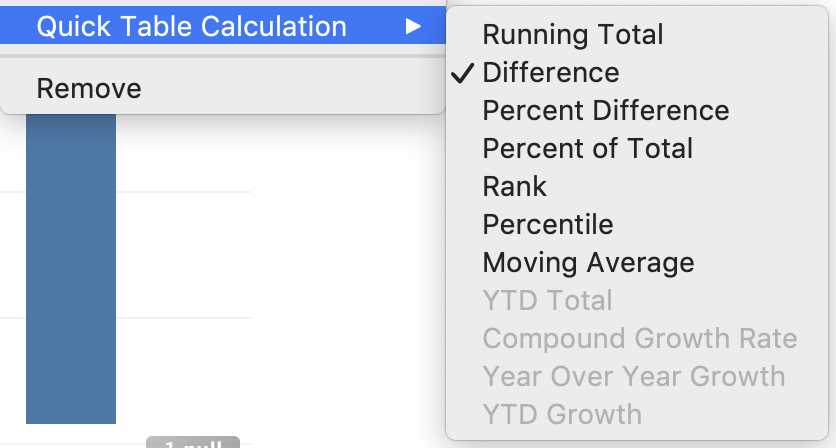
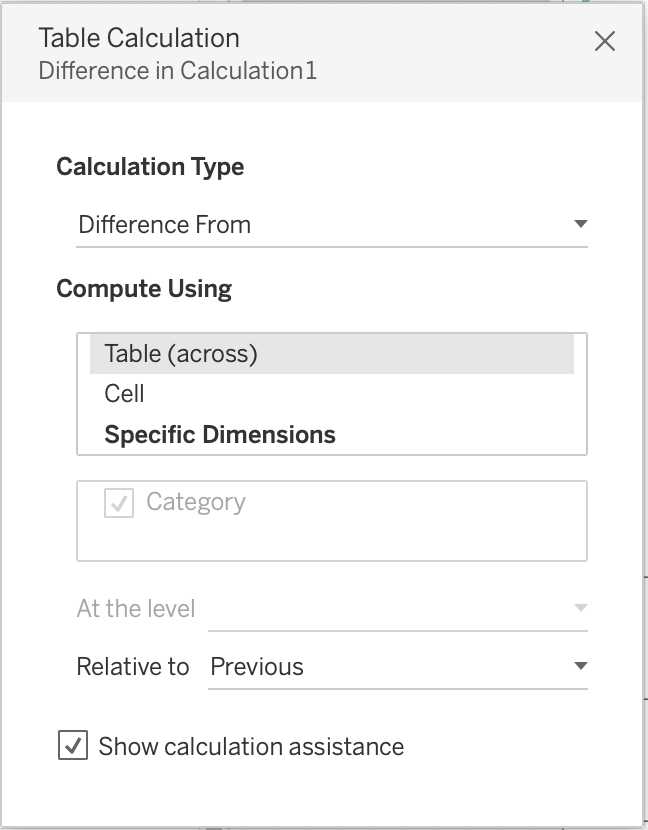
These can be calculated using : Table(across), Cell, or Specific dimensions!
Reference: https://help.tableau.com/current/pro/desktop/en-
us/calculations_tablecalculations_definebasic_runningtotal.htm
Question 11
By default, measures placed in a view are aggregated by ______________
- A. COUNT
- B. AVERAGE
- C. MEDIAN
- D. SUM
Answer:
D
Explanation:
By default, measures placed in a view are aggregated by SUM, which means that the data for that
field in all of the rows is combined. Measures can also be aggregated as average, median, count, or
count distinct.
Reference: https://help.tableau.com/current/pro/desktop/en-us/calculations_aggregation.htm
Question 12
______________ refers to the level of detail for a piece of data, wherever you are looking.
- A. Data Cleanliness
- B. Data granularity
- C. Data connectivity
- D. Data LOD
Answer:
B
Explanation:
Data is generated and analyzed at many different levels of granularity. Granularity is the level of
detail of the data. For example, when looking at graduation data, granularity would describe whether
a row in the data set represents a single person or the graduating class of a university.
Reference: https://www.tableau.com/about/blog/2018/6/data-prep-101-what-aggregate-function-
and-how-do-you-combine-aggregated-data-89244
Question 13
For Bullet Graphs we need at least ____________ measures
- A. 3
- B. 1
- C. 2
- D. 4
Answer:
C
Explanation:
A bullet graph is a variation of a bar graph developed to replace dashboard gauges and meters. A
bullet graph is useful for comparing the performance of a primary measure to one or more other
measures.
Therefore, we need at least 2 measures for creating bullet graphs.
Reference: https://help.tableau.com/current/pro/desktop/en-us/qs_bullet_graphs.htm
Question 14
The default path for all supporting files, data sources, icons, logs etc is in ______________________
- A. Documents -> Tableau Files
- B. Documents -> Tableau
- C. Documents -> My Tableau Repository
- D. Downloads -> Tableau Support Files
Answer:
C
Explanation:
By default, all of the above mentioned are stored in Documents -> My Tableau Repository
Reference: https://help.tableau.com/current/pro/desktop/en-us/environ_filesandfolders.htm
Question 15
Tableau auto-generates ____________ dimension(s) and _____________ measure(s) for us
- A. 1 , 4
- B. 2 , 2
- C. 2 , 3
- D. 1 , 2
Answer:
A
Explanation:
Tableau auto-generates :
1 Dimension - Measure Names
4 Measures - Latitude, Longitude, Number of records, Measure Values
Starting with Tableau 2020.2, every table in a data source has a Count field, in the form of
NameofTable(Count). The table count field is an automatically generated, calculated field. (THIS IS
NOT PRESENT IN VERSION 2020.1 ON WHICH THE EXAM IS CURRENTLY BASED)
Reference: https://help.tableau.com/current/pro/desktop/en-
us/datafields_understanddatawindow.htm