tableau tcc-c01 practice test
Tableau Certified Consultant
Question 1
A consultant creates a histogram that presents the distribution of profits across a client's customers.
The labels on the bars show percent shares. The consultant
used a quick table calculation to create the labels.
Now, the client wants to limit the view to the bins that have at least a 15% share. The consultant
creates a profit filter but it changes the percent labels.
Which approach should the consultant use to produce the desired result?
- A. Use a calculation with TOTAL() function instead of a quick table calculation.
- B. Add the [Profit] filter to the context.
- C. Filter with a table calculation WINDOW_AVG(MIN([Profit]), first(), last())
- D. Filter with the table calculation used to create labels.
Answer:
B
Explanation:
When a filter is applied directly to the view, it can affect the calculation of percentages in a
histogram because it changes the underlying data that the quick table calculation is based on. To
avoid this, adding the [Profit] filter to the context will maintain the original calculation of percent
shares while filtering out bins with less than a 15% share. This is because context filters are applied
before any other calculations, so the percent shares calculated will be based on the context-filtered
data, thus preserving the integrity of the original percent labels.
Reference: The solution is based on the principles of context filters and their order of operations in
Tableau, which are documented in Tableau’s official resources and community discussions123
.
When a histogram is created showing the distribution of profits with labels indicating percent shares
using a quick table calculation, and a need arises to limit the view to bins with at least a 15% share,
applying a standard profit filter directly may undesirably alter how the percent labels calculate
because they depend on the overall distribution of data. Placing the [Profit] filter into the context
makes it a "context filter," which effectively changes how data is filtered in calculations:
Create a Context Filter: Right-click on the profit filter and select "Add to Context". This action changes
the order of operations in filtering, meaning the context filter is applied first.
Adjust the Percent Calculation: With the profit filter set in the context, it first reduces the data set to
only those profits that meet the filter criteria. Subsequently, any table calculations (like the percent
share labels) are computed based on this reduced data set.
View Update: The view now updates to display only those bins where the profits are at least 15%,
and the percent share labels recalculated to reflect the distribution of only the filtered (contextual)
data.
Reference:
Context Filters in Tableau: Context filters are used to filter the data passed down to other filters,
calculations, the marks card, and the view. By setting the profit filter as a context filter, it ensures that
calculations such as the percentage shares are based only on the filtered subset of the data.
Question 2
A client has many published data sources in Tableau Server. The data sources use the same databases
and tables. The client notices different departments
give different answers to the same business questions, and the departments cannot trust the data.
The client wants to know what causes data sources to return
different data.
Which tool should the client use to identify this issue?
- A. Tableau Prep Conductor
- B. Ask Data
- C. Tableau Catalog
- D. Tableau Resource Monitoring Tool
Answer:
C
Explanation:
The Tableau Catalog is part of the Tableau Data Management Add-on and is designed to help users
understand the data they are using within Tableau. It provides a comprehensive view of all the data
assets in Tableau Server or Tableau Online, including databases, tables, and fields. It can help identify
issues such as data quality, data lineage, and impact analysis. In this case, where different
departments are getting different answers to the same business questions, the Tableau Catalog can
be used to track down inconsistencies and ensure that everyone is working from the same, reliable
data source.
Reference: The recommendation for using Tableau Catalog is based on its features that support data
discovery, quality, and governance, which are essential for resolving data inconsistencies across
different departments12
.
When different departments report different answers to the same business questions using the same
databases and tables, the issue often lies in how data is being accessed and interpreted differently
across departments. Tableau Catalog, a part of Tableau Data Management, can be used to solve this
problem:
Visibility: Tableau Catalog gives visibility into the data used in Tableau, showing users where data
comes from, where it’s used, and who’s using it.
Consistency and Trust: It helps ensure consistency and trust in data by providing detailed metadata
management that can highlight discrepancies in data usage or interpretation.
Usage Metrics and Lineage: It offers tools for tracking usage metrics and understanding data lineage,
which can help in identifying why different departments might see different results from the same
underlying data.
Reference:
Tableau Catalog Usage: The Catalog is instrumental in providing a detailed view of the data
environment, allowing organizations to audit, track, and understand data discrepancies across
different users and departments.
Question 3
A client collects information about a web browser customers use to access their website. They then
visualize the breakdown of web traffic by browser version.
The data is stored in the format shown below in the related table, with a NULL BrowserID stored in
the Site Visitor Table if an unknown browser version
accesses their website.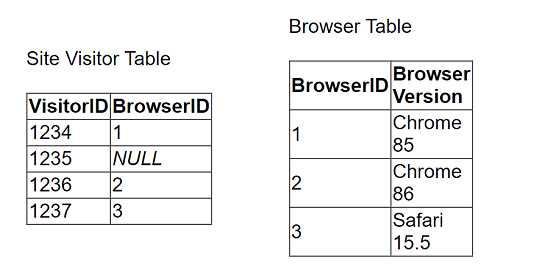
The client uses "Some Records Match" for the Referential Integrity setting because a match is not
guaranteed. The client wants to improve the performance of
the dashboard while also getting an accurate count of site visitors.
Which modifications to the data tables and join should the consultant recommend?
- A. Continue to use NULL as the BrowserID in the Site Visitor Table and leave the Referential Integrity set to "Some Records Match."
- B. Add an "Unknown" option to the Browser Table, reference its BrowserID in the Site Visitor Table, and change the Referential Integrity to "All Records Match."
- C. Add an "Unknown" option to the Browser Table, reference its BrowserID in the Site Visitor Table, and leave the Referential Integrity set to "Some Records Match."
- D. Continue to use NULL as the BrowserID in the Site Visitor Table and change the Referential Integrity to "All Records Match."
Answer:
B
Explanation:
To improve the performance of a Tableau dashboard while maintaining accurate counts, particularly
when dealing with unknown or NULL BrowserIDs in the data tables, the following steps are
recommended:
Modify the Browser Table: Add a new row to the Browser Table labeled "Unknown," assigning it a
unique BrowserID, e.g., 0 or 4.
Update the Site Visitor Table: Replace all NULL BrowserID entries with the BrowserID assigned to the
"Unknown" entry. This ensures every record in the Site Visitor Table has a valid BrowserID that
corresponds to an entry in the Browser Table.
Change Referential Integrity Setting: Change the Referential Integrity setting from "Some Records
Match" to "All Records Match." This change assumes all records in the primary table have
corresponding records in the secondary table, which improves query performance by allowing
Tableau to make optimizations based on this assumption.
Reference:
Handling NULL Values: Replacing NULL values with a valid unknown option ensures that all data is
included in the analysis, and integrity between tables is maintained, thereby optimizing the
performance and accuracy of the dashboard.
Question 4
A stakeholder has multiple files saved (CSV/Tables) in a single location. A few files from the location
are required for analysis. Data transformation (calculations)
is required for the files before designing the visuals. The files have the following attributes:
. All files have the same schema.
. Multiple files have something in common among their file names.
. Each file has a unique key column.
Which data transformation strategy should the consultant use to deliver the best optimized result?
- A. Use join option to combine/merge all the files together before doing the data transformation (calculations).
- B. Use wildcard Union option to combine/merge all the files together before doing the data transformation (calculations).
- C. Apply the data transformation (calculations) in each require file and do the wildcard union to combine/merge before designing the visuals.
- D. Apply the data transformation (calculations) in each require file and do the join to combine/merge before designing the visuals.
Answer:
B
Explanation:
Moving calculations to the data layer and materializing them in the extract can significantly improve
the performance of reports in Tableau. The calculation ZN([Sales])*(1 - ZN([Discount])) is a basic
calculation that can be easily computed in advance and stored in the extract, speeding up future
queries.
This type of calculation is less complex than table calculations or LOD expressions, which are
better suited for dynamic analysis and may not benefit as much from materialization12
.
Reference: The answer is based on the best practices for creating efficient calculations in Tableau, as
described in Tableau’s official documentation, which suggests using basic and aggregate calculations
to improve performance1
.
Additionally, the process of materializing calculations in extracts is
detailed in Tableau’s resources2
.
Given that all files share the same schema and have a common element in their file names, the
wildcard union is an optimal approach to combine these files before performing any transformations.
This strategy offers the following advantages:
Efficient Data Combination: Wildcard union allows multiple files with a common naming scheme to
be combined into a single dataset in Tableau, streamlining the data preparation process.
Uniform Schema Handling: Since all files share the same schema, wildcard union ensures that the
combined dataset maintains consistency in data structure, making further data manipulation more
straightforward.
Pre-Transformation Combination: Combining the files before applying transformations is generally
more efficient as it reduces redundancy in transformation logic across multiple files. This means
transformations are written and processed once on the unified dataset, rather than repeatedly for
each individual file.
Reference:
Wildcard Union in Tableau: This feature simplifies the process of combining multiple similar files into
a single Tableau data source, ensuring a seamless and efficient approach to data integration and
preparation.
Question 5
A consultant wants to improve the performance of reports by moving calculations to the data layer
and materializing them in the extract.
Which calculation should the consultant use?
- A. ZN([Sales])*(1 - ZN([Discount]))
- B. CASE [Sector Parameter] WHEN 1 THEN "green" WHEN 2 THEN "yellow"
- C. SUM([Profit])/SUM([Sales])
- D. POWER(ZN(SUM([Sales]))/ LOOKUP(ZN(SUM([Sales])), FIRST()),ZN(1/(INDEX()-1))) - 1 END
Answer:
C
Explanation:
To improve performance by moving calculations to the data layer and materializing them in the
extract, the consultant should choose calculations that benefit from pre-computation and
significantly reduce the load during query time:
Aggregation-Level Calculation: The formula SUM([Profit])/SUM([Sales]) calculates a ratio at an
aggregate level, which is ideal for pre-computation. Materializing this calculation in the extract
means that the complex division operation is done once and stored, rather than being recalculated
every time the report is accessed.
Performance Improvement: By pre-computing this aggregate ratio, Tableau can utilize the pre-
calculated fields directly in visualizations, which speeds up report loading and interaction times as
the heavy lifting of data processing is done during the data preparation stage.
Reference:
Materialization in Extracts: This concept involves pre-calculating and storing complex aggregations or
calculations within the Tableau data extract itself, improving performance by reducing the
computational load during visualization rendering.
Question 6
An online sales company has a table data source that contains Order Date. Products ship on the first
day of each month for all orders from the previous month.
The consultant needs to know the average number of days that a customer must wait before a
product is shipped.
Which calculation should the consultant use?
- A. Calc1: DATETRUNC ('month', DATEADD('month', 1, [Order Date])) Calc2: AVG(DATEDIFF ('week', [Order Date], [Calc1]))
- B. Calc1: DATETRUNC ('month', DATEADD ('month', 1, [Order Date])) Calc2: AVG(DATEDIFF ('day', [Order Date], [Calc1]))
- C. Calc1: DATETRUNC ('day', DATEADD('week', 4, [Order Date])) Calc2: AVG([Order Date] - [Calc1])
- D. Calc1: DATETRUNC ('day', DATEADD ('day', 31, [Order Date])) Calc2: AVG ([Order Date] - [Calc1])
Answer:
B
Explanation:
The correct calculation to determine the average number of days a customer must wait before a
product is shipped is to first find the shipping date, which is the first day of the following month after
the order date. This is done using DATETRUNC('month', DATEADD('month', 1, [Order Date])). Then,
the average difference in days between the order date and the shipping date is calculated using
AVG(DATEDIFF('day', [Order Date], [Calc1])). This approach ensures that the average wait time is
calculated in days, which is the most precise measure for this scenario.
Reference: The solution is based on Tableau’s date functions and their use in calculating differences
between dates, which are well-documented in Tableau’s official learning resources and consultant
documents12
.
To calculate the average waiting days from order placement to shipping, where shipping occurs on
the first day of the following month:
Calculate Shipping Date (Calc1): Use the DATEADD function to add one month to the order date, then
apply DATETRUNC to truncate this date to the first day of that month. This represents the shipping
date for each order.
Calculate Average Wait Time (Calc2): Use DATEDIFF to calculate the difference in days between the
original order date and the calculated shipping date (Calc1). Then, use AVG to average these
differences across all orders, giving the average number of days customers wait before their products
are shipped.
Reference:
Date Functions in Tableau: Functions like DATEADD, DATETRUNC, and DATEDIFF are used to
manipulate and calculate differences between dates, crucial for creating metrics that depend on
time intervals, such as customer wait times in this scenario.
Question 7
A client notices that while creating calculated fields, occasionally the new fields are created as
strings, integers, or Booleans. The client asks a consultant if
there is a performance difference among these three data types.
What should the consultant tell the customer?
- A. Strings are fastest, followed by integers, and then Booleans.
- B. Integers are fastest, followed by Booleans, and then strings.
- C. Strings, integers, and Booleans all perform the same.
- D. Booleans are fastest, followed by integers, and then strings.
Answer:
B
Explanation:
In Tableau, the performance of calculated fields can vary based on the data type used. Calculations
involving integers and Booleans are generally faster than those involving strings. This is because
numerical operations are typically more efficient for a computer to process than string operations,
which can be more complex and time-consuming. Therefore, when performance is a consideration, it
is advisable to use integers or Booleans over strings whenever possible.
Reference: The performance hierarchy of data types in Tableau calculations is documented in
resources that discuss best practices for optimizing Tableau performance1
.
Question 8
A client has a large data set that contains more than 10 million rows.
A consultant wants to calculate a profitability threshold as efficiently as possible. The calculation
must classify the profits by using the following specifications:
. Classify profit margins above 50% as Highly Profitable.
. Classify profit margins between 0% and 50% as Profitable.
. Classify profit margins below 0% as Unprofitable.
Which calculation meets these requirements?
- A. IF [ProfitMargin]>0.50 Then 'Highly Profitable' ELSEIF [ProfitMargin]>=0 Then 'Profitable' ELSE 'Unprofitable' END
- B. IF [ProfitMargin]>=0.50 Then 'Highly Profitable' ELSEIF [ProfitMargin]>=0 Then 'Profitable' ELSE 'Unprofitable' END
- C. IF [ProfitMargin]>0.50 Then 'Highly Profitable' ELSEIF [ProfitMargin]>=0 Then 'Profitable' ELSEIF [ProfitMargin] <0 Then 'Unprofitable' END
- D. IF([ProfitMargin]>=0.50,'Highly Profitable', 'Profitable') ELSE 'Unprofitable' END
Answer:
B
Explanation:
The correct calculation for classifying profit margins into categories based on specified thresholds
involves the use of conditional statements that check ranges in a logical order:
Highly Profitable Classification: The first condition checks if the profit margin is 50% or more. This
must use the ">=" operator to include exactly 50% as "Highly Profitable".
Profitable Classification: The next condition checks if the profit margin is between 0% and 50%. Since
any value falling at or above 50% is already classified, this condition only needs to check for values
greater than or equal to 0%.
Unprofitable Classification: The final condition captures any remaining scenarios, which would only
be values less than 0%.
Reference:
Logical Order in Conditional Statements: It is crucial in programming and data calculation to ensure
that conditions in IF statements are structured in a logical and non-overlapping manner to accurately
categorize all possible values.
Question 9
An executive-level workbook leverages 37 of the 103 fields included in a data source. Performance
for the workbook is noticeably slower than other workbooks
on the same Tableau Server.
What should the consultant do to improve performance of this workbook while following best
practice?
- A. Split some visualizations on the dashboard into many smaller visualizations on the same dashboard.
- B. Connect to the data source via a custom SQL query.
- C. Use filters, hide unused fields, and aggregate values. OD. Restrict users from accessing the workbook to reduce server load.
Answer:
C
Explanation:
To improve the performance of a Tableau workbook, it is best practice to streamline the data being
used. This can be achieved by using filters to limit the data to only what is necessary for analysis,
hiding fields that are not being used to reduce the complexity of the data model, and aggregating
values to simplify the data and reduce the number of rows that need to be processed. These steps
can help reduce the load on the server and improve the speed of the workbook.
Reference: The best practices for optimizing workbook performance in Tableau are well-documented
in Tableau’s official resources, including the Tableau Help Guide and the Designing Efficient
Workbooks whitepaper, which provide detailed recommendations on how to streamline workbooks
for better performance12
.
Question 10
A client wants to see the average number of orders per customer per month, broken down by region.
The client has created the following calculated field:
Orders per Customer: {FIXED [Customer ID]: COUNTD([Order ID])}
The client then creates a line chart that plots AVG(Orders per Customer) over MONTH(Order Date) by
Region. The numbers shown by this chart are far higher
than the customer expects.
The client asks a consultant to rewrite the calculation so the result meets their expectation.
Which calculation should the consultant use?
- A. {INCLUDE [Customer ID]: COUNTD([Order ID])}
- B. {FIXED [Customer ID], [Region]: COUNTD([Order ID])}
- C. {EXCLUDE [Customer ID]: COUNTD([Order ID])}
- D. {FIXED [Customer ID], [Region], [Order Date]: COUNTD([Order ID])}
Answer:
B
Explanation:
The calculation {FIXED [Customer ID], [Region]: COUNTD([Order ID])} is the correct one to use for
this scenario. This Level of Detail (LOD) expression will calculate the distinct count of orders for each
customer within each region, which is then averaged per month. This approach ensures that the
average number of orders per customer is accurately calculated for each region and then broken
down by month, aligning with the client’s expectations.
Reference: The LOD expressions in Tableau allow for precise control over the level of detail at which
calculations are performed, which is essential for accurate data analysis.
The use of {FIXED}
expressions to specify the granularity of the calculation is a common practice and is well-
documented in Tableau’s official resources12
.
The initial calculation provided by the client likely overestimates the average number of orders per
customer per month by region due to improper granularity control. The revised calculation must take
into account both the customer and the region to correctly aggregate the data:
FIXED Level of Detail Expression: This calculation uses a FIXED expression to count distinct order IDs
for each customer within each region. This ensures that the count of orders is correctly grouped by
both customer ID and region, addressing potential duplication or misaggregation issues.
Accurate Aggregation: By specifying both [Customer ID] and [Region] in the FIXED expression, the
calculation prevents the overcounting of orders that may appear if only customer ID was considered,
especially when a customer could be ordering from multiple regions.
Reference:
Level of Detail Expressions in Tableau: These expressions allow you to specify the level of granularity
you need for your calculations, independent of the visualization's level of detail, thus offering precise
control over data aggregation.
Question 11
A client builds a dashboard that presents current and long-term stock measures. Currently, the data
is at a daily level. The data presents as a bar chart that
presents monthly results over current and previous years. Some measures must present as monthly
averages.
What should the consultant recommend to limit the data source for optimal performance?
- A. Limit data to current and previous years and leave data at daily level to calculate the averages in the report.
- B. Limit data to current and previous years, move calculating averages to data layer, and aggregate dates to monthly level.
- C. Move calculating averages to data layer and aggregate dates to monthly level.
- D. Limit data to current and previous years as well as to the last day of each month to eliminate the need to use the averages.
Answer:
B
Explanation:
For optimal performance, it is recommended to limit the data to what is necessary for analysis,
which in this case would be the current and previous years. Moving the calculation of averages to the
data layer and aggregating the dates to a monthly level will reduce the granularity of the data,
thereby improving the performance of the dashboard.
This approach aligns with best practices for
optimizing workbook performance in Tableau, which suggest simplifying the data model and
reducing the number of records processed12
.
Reference: The recommendation is based on the guidelines provided in Tableau’s official
documentation on optimizing workbook performance, which includes tips on data management and
aggregation for better performance12
.
Question 12
A consultant builds a report where profit margin is calculated as SUM([Profit]) / SUM([Sales]). Three
groups of users are organized on Tableau Server with the
following levels of data access that they can be granted.
. Group 1: Viewers who cannot see any information on profitability
. Group 2: Viewers who can see profit and profit margin
. Group 3: Viewers who can see profit margin but not the value of profit
Which approach should the consultant use to provide the required level of access?
- A. Use user filters to access data on profitability to all groups. Then, create a calculated field that allows visibility of profit value to Group 2 and use the calculation in the view in the report.
- B. Specify in the row-level security (RLS) entitlement table individuals who can see profit, profit margin, or none of these. Then, use the table data to create user filters in the report.
- C. Use user filters to allow only Groups 2 and 3 access to data on profitability. Then, create a calculated field that limits visibility of profit value to Group 2 and use the calculation in the view in the report.
- D. Specify with user filters in each view individuals who can see profit, profit margin, or none of these.
Answer:
C
Explanation:
The approach of using user filters to control access to data on profitability for Groups 2 and 3,
combined with a calculated field that restricts the visibility of profit value to only Group 2, aligns with
Tableau’s best practices for managing content permissions. This method ensures that each group
sees only the data they are permitted to view, with Group 1 not seeing any profitability information,
Group 2 seeing both profit and profit margin, and Group 3 seeing only the profit margin without the
actual profit values.
This setup can be achieved through Tableau Server’s permission capabilities,
which allow for detailed control over what each user or group can see and interact with12
.
Reference: The solution is based on the capabilities and permission rules that are part of Tableau
Server’s security model, as detailed in the official Tableau documentation12
. These resources provide
guidance on how to set up user filters and calculated fields to manage data access levels effectively.
Question 13
A company has a data source for sales transactions. The data source has the following characteristics:
. Millions of transactions occur weekly.
. The transactions are added nightly.
. Incorrect transactions are revised every week on Saturday.
· The end users need to see up-to-date data daily.
A consultant needs to publish a data source in Tableau Server to ensure that all the transactions in
the data source are available.
What should the consultant do to create and publish the data?
- A. Publish an incremental extract refresh every day and perform a full extract refresh every Saturday.
- B. Publish a live connection to Tableau Server.
- C. Publish an incremental refresh every Saturday.
- D. Publish an incremental extract refresh every day and publish a secondary data set containing data revisions.
Answer:
A
Explanation:
Given the need for up-to-date data on a daily basis and weekly revisions, the best approach is to use
an incremental extract refresh daily to update the data source with new transactions. On Saturdays,
when incorrect transactions are revised, a full extract refresh should be performed to incorporate all
revisions and ensure the data’s accuracy.
This strategy allows end users to have access to the most
current data throughout the week while also accounting for any necessary corrections12
.
Reference: The solution is based on best practices for managing data sources in Tableau Server, which
recommend using incremental refreshes for frequent updates and full refreshes when significant
changes or corrections are made to the data12
.
Question 14
A Tableau Cloud client has requested a custom dashboard to help track which data sources are used
most frequently in dashboards across their site.
Which two actions should the client use to access the necessary metadata? Choose two.
- A. Connect directly to the Site Content data source within the Admin Insights project.
- B. Query metadata through the GraphiQL engine.
- C. Access metadata through the Metadata API.
- D. Download metadata through Tableau Catalog.
Answer:
BC
Explanation:
To track which data sources are used most frequently across a site in Tableau Cloud, the client should
use the GraphiQL engine and the Metadata API.
The GraphiQL engine allows for interactive
exploration of the metadata, making it easier to construct and test queries1
.
The Metadata API
provides access to metadata and lineage of external assets used by the content published to Tableau
Cloud, which is essential for tracking data source usage2
.
Reference: The actions are based on the capabilities of the GraphiQL engine and the Metadata API as
described in Tableau’s official documentation and learning resources321
.
Question 15
A client wants to report Saturday and Sunday regardless of the workbook's data source's locale
settings.
Which calculation should the consultant recommend?
- A. DATEPART('weekday', [Order Date])>=6
- B. DATEPART('iso-weekday', [Order Date])>=6
- C. DATENAME('iso-weekday', [Order Date])>=6
- D. DATEPART('iso-weekday', [Order Date])=1 or DATEPART('iso-weekday', [Order Date])=7
Answer:
D
Explanation:
The calculation DATEPART('iso-weekday', [Order Date])=1 or DATEPART('iso-weekday', [Order
Date])=7 is recommended because the ISO standard considers Monday as the first day of the week
(1) and Sunday as the last day (7). This calculation will correctly identify Saturdays and Sundays
regardless of the locale settings of the workbook’s data source, ensuring that the report includes
these days as specified by the client.
Reference: The use of the ‘iso-weekday’ part in the DATEPART function is consistent with the ISO
8601 standard, which is independent of locale settings.
This approach is supported by Tableau’s
documentation on date functions and their behavior with different locale settings123
.
To accurately identify weekends across different locale settings, using the 'iso-weekday' component
is reliable as it is consistent across various locales:
ISO Weekday Function: The ISO standard treats Monday as the first day of the week (1), which makes
Sunday the seventh day (7). This standardization helps avoid discrepancies in weekday calculations
that might arise due to locale-specific settings.
Identifying Weekends: The calculation checks if the 'iso-weekday' part of the date is either 1 (Sunday)
or 7 (Saturday), thereby correctly identifying weekends regardless of the locale settings.
Reference:
Handling Locale-Specific Settings: Using ISO standards in date functions allows for uniform results
across systems with differing locale settings, essential for consistent reporting in global applications.