six sigma clssbb practice test
Certified Lean Six Sigma Black Belt Exam
Question 1
A ___________ is used primarily to track the stability of the average value of a metric of interest.
- A. NP Chart
- B. Xbar-R Chart
- C. I-MR Chart
- D. C Chart
Answer:
B
Question 2
For her injection molding project a Belt needed to track the percentage of defectives of a particular
sample set so she used a ___________ to display the data?
- A. Individual Chart
- B. C Chart
- C. Xbar Chart
- D. P Chart
Answer:
D
Question 3
Which of these graphs demonstrates conditions which would be sufficient to enable OCAP for the
process?
- A. Xbar Chart
- B. Time Series Chart
- C. Neither
- D. Both
Answer:
A
Question 4
Control Charts were developed by Dr. Shewhart to track data over time. To detect Special Cause
variation the Control Charts use which of these?
- A. Data shift analysis
- B. Outlier analysis methods
- C. Center Line and Control Limits
- D. None of the above
Answer:
C
Question 5
Common and ______________ Cause Variation are the focus of Statistical Process Control.
- A. Uncommon
- B. Ordinary
- C. Special
- D. Selective
Answer:
C
Question 6
Special Cause Variation falls into which two categories?
- A. Natural & Unnatural
- B. Short Term & Long Term
- C. Assignable & Pattern
- D. Attribute & Discreet
Answer:
C
Question 7
Range Charts are the technique used to determine if Special Causes are occurring within the
subgroups of the ______________.
- A. Histograms
- B. SPC Charts
- C. NP Charts
- D. Pareto Charts
Answer:
B
Question 8
If the production is for higher volume and monitoring and the Mean and variability is to be
monitored for four machines producing product and the characteristic to be monitored is Variable
Data, which SPC Chart is best to be selected?
- A. Xbar-R Chart
- B. Individual-MR Chart
- C. NP Chart
- D. CUSUM Chart
Answer:
A
Question 9
When a Belt Poka-Yoke’s a defect out of the process entirely then she should track the activity with a
robust SPC system on the characteristic of interest in the defect as an early warning system.
- A. True
- B. False
Answer:
B
Question 10
Following the completion of a LSS project the Belt not only creates a Control Plan he also develops a
_____________ so those involved in the process know what to do when the critical metrics move
out of spec.
- A. Response Plan
- B. Call List
- C. Chain-of-Command
- D. Defect Analysis Plan
Answer:
A
Question 11
The Control Limits width varies if the sample size varies for which type of chart?
- A. P Charts
- B. NP Charts
- C. Xbar-R Charts
- D. Time Series Charts
Answer:
A
Question 12
Which of these elements are not included in Implementation plans?
- A. Work breakdown structure
- B. Risk management plans
- C. Cost/Benefit ratios
- D. Planned audits of work completion
Answer:
C
Question 13
Upon completion and validation of an improvement to a process a Belt and the Project Team create a
Control Plan that contains which of these?
- A. Standard operating work description of the process change
- B. Description of the monitoring system in place to assure continued compliance
- C. Summary of the targeted critical metrics for process performance measurement
- D. All of the above
Answer:
D
Question 14
What conclusion is most correct about the Experimental Design shown here with the response in the
far right column?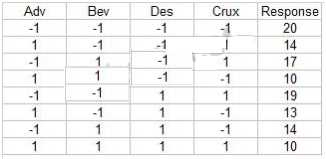
- A. No factor has enough statistical confidence greater than 95% to have an impact on the response rate
- B. Constant, Adv and Bev are the only factors statistically affecting the response rate with 95% confidence or more
- C. If the Adv is increased from the low level to the high level, the response rate increases
- D. The response level is statistically concluded to only need the Adv and Bev factors set at the low level to get the largest response rate
- E. This design does not have enough experimental runs to conclude anything as evidenced by the lack of P-values in the MINITABTM output
Answer:
D
Question 15
Which statement(s) are correct about the Factorial Plot shown here? (Note: There are 3 correct
answers).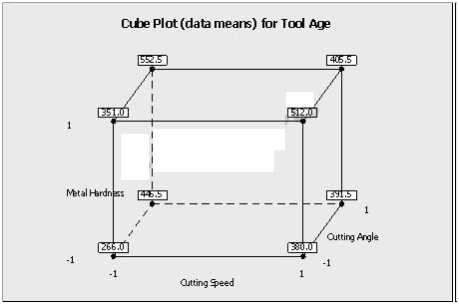
- A. When the cutting speed increased from low to high level, the tool age increases
- B. The coefficient of the metal hardness is positively related to the output of tool age
- C. The coded coefficient is lower for cutting speed than the cutting angle related to the output of tool age
- D. These plots prove a statistically significance factor with 95% confidence
- E. These plots are an example of interaction plots
Answer:
A,B,C