Nutanix ncm-mci practice test
Multicloud Infrastructure
Question 1
Task 1
An administrator has been asked to configure a storage for a distributed application which uses large
data sets across multiple worker VMs.
The worker VMs must run on every node. Data resilience is provided at the application level and low
cost per GB is a Key Requirement.
Configure the storage on the cluster to meet these requirements. Any new object created should
include the phrase Distributed_App in the name.
Answer:
See the
Explanation for step
by step solution.
Explanation:
To configure the storage on the cluster for the distributed application, you can follow these steps:
Log in to Prism Element of cluster A using the credentials provided.
Go to Storage > Storage Pools and click on Create Storage Pool.
Enter a name for the new storage pool, such as Distributed_App_Storage_Pool, and select the disks
to include in the pool. You can choose any combination of SSDs and HDDs, but for low cost per GB,
you may prefer to use more HDDs than SSDs.
Click Save to create the storage pool.
Go to Storage > Containers and click on Create Container.
Enter a name for the new container, such as Distributed_App_Container, and select the storage pool
that you just created, Distributed_App_Storage_Pool, as the source.
Under Advanced Settings, enable Erasure Coding and Compression to reduce the storage footprint of
the dat
a. You can also disable Replication Factor since data resilience is provided at the application level.
These settings will help you achieve low cost per GB for the container.
Click Save to create the container.
Go to Storage > Datastores and click on Create Datastore.
Enter a name for the new datastore, such as Distributed_App_Datastore, and select NFS as the
datastore type. Select the container that you just created, Distributed_App_Container, as the source.
Click Save to create the datastore.
The datastore will be automatically mounted on all nodes in the cluster. You can verify this by going
to Storage > Datastores and clicking on Distributed_App_Datastore. You should see all nodes listed
under Hosts.
You can now create or migrate your worker VMs to this datastore and run them on any node in the
cluster. The datastore will provide low cost per GB and high performance for your distributed
application.
Question 2
Task 2
An administrator needs to configure storage for a Citrix-based Virtual Desktop infrastructure.
Two VDI pools will be created
Non-persistent pool names MCS_Pool for tasks users using MCS Microsoft Windows 10 virtual
Delivery Agents (VDAs)
Persistent pool named Persist_Pool with full-clone Microsoft Windows 10 VDAs for power users
20 GiB capacity must be guaranteed at the storage container level for all power user VDAs
The power user container should not be able to use more than 100 GiB
Storage capacity should be optimized for each desktop pool.
Configure the storage to meet these requirements. Any new object created should include the name
of the pool(s) (MCS and/or Persist) that will use the object.
Do not include the pool name if the object will not be used by that pool.
Any additional licenses required by the solution will be added later.
Answer:
See the
Explanation for step
by step solution.
Explanation:
To configure the storage for the Citrix-based VDI, you can follow these steps:
Log in to Prism Central using the credentials provided.
Go to Storage > Storage Pools and click on Create Storage Pool.
Enter a name for the new storage pool, such as VDI_Storage_Pool, and select the disks to include in
the pool. You can choose any combination of SSDs and HDDs, but for optimal performance, you may
prefer to use more SSDs than HDDs.
Click Save to create the storage pool.
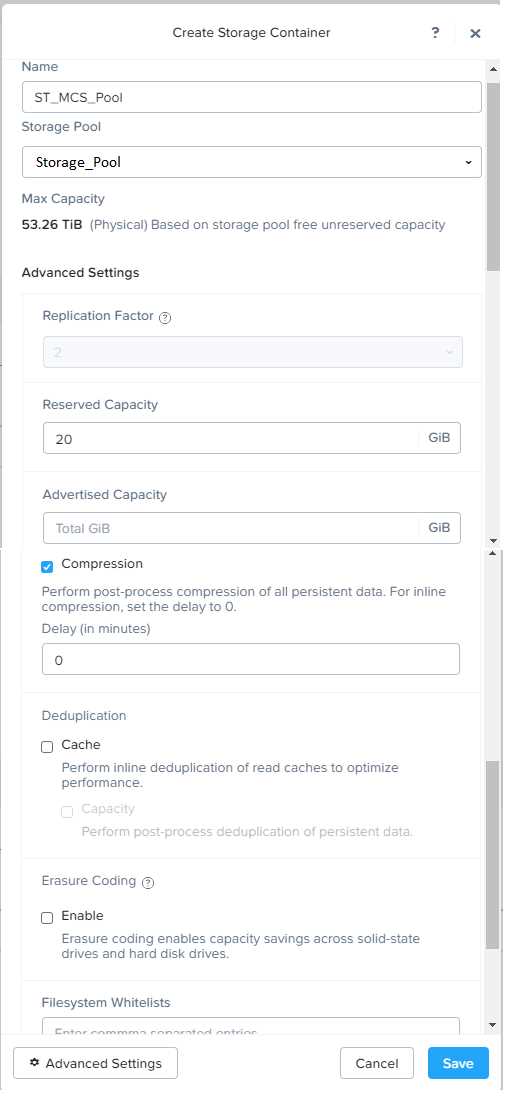
Go to Storage > Containers and click on Create Container.
Enter a name for the new container for the non-persistent pool, such as MCS_Pool_Container, and
select the storage pool that you just created, VDI_Storage_Pool, as the source.
Under Advanced Settings, enable Deduplication and Compression to reduce the storage footprint of
the non-persistent desktops. You can also enable Erasure Coding if you have enough nodes in your
cluster and want to save more space. These settings will help you optimize the storage capacity for
the non-persistent pool.
Click Save to create the container.
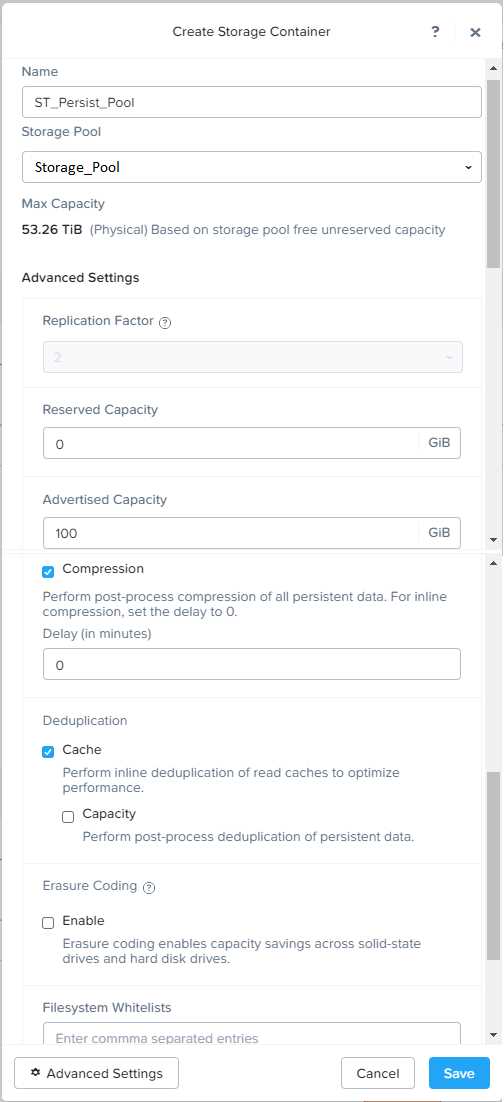
Go to Storage > Containers and click on Create Container again.
Enter a name for the new container for the persistent pool, such as Persist_Pool_Container, and
select the same storage pool, VDI_Storage_Pool, as the source.
Under Advanced Settings, enable Capacity Reservation and enter 20 GiB as the reserved capacity.
This will guarantee that 20 GiB of space is always available for the persistent desktops. You can also
enter 100 GiB as the advertised capacity to limit the maximum space that this container can use.
These settings will help you control the storage allocation for the persistent pool.
Click Save to create the container.
Go to Storage > Datastores and click on Create Datastore.
Enter a name for the new datastore for the non-persistent pool, such as MCS_Pool_Datastore, and
select NFS as the datastore type. Select the container that you just created, MCS_Pool_Container, as
the source.
Click Save to create the datastore.
Go to Storage > Datastores and click on Create Datastore again.
Enter a name for the new datastore for the persistent pool, such as Persist_Pool_Datastore, and
select NFS as the datastore type. Select the container that you just created, Persist_Pool_Container,
as the source.
Click Save to create the datastore.
The datastores will be automatically mounted on all nodes in the cluster. You can verify this by going
to Storage > Datastores and clicking on each datastore. You should see all nodes listed under Hosts.
You can now use Citrix Studio to create your VDI pools using MCS or full clones on these datastores.
For more information on how to use Citrix Studio with Nutanix Acropolis, see
Citrix Virtual Apps and
Desktops on Nutanix
or
Nutanix virtualization environments
.
https://portal.nutanix.com/page/documents/solutions/details?targetId=BP-2079-Citrix-Virtual-Apps-and-Desktops:bp-nutanix-storage-configuration.html
Question 3
Task 3
An administrator needs to assess performance gains provided by AHV Turbo at the guest level. To
perform the test the administrator created a Windows 10 VM named Turbo with the following
configuration.
1 vCPU
8 GB RAM
SATA Controller
40 GB vDisk
The stress test application is multi-threaded capable, but the performance is not as expected with
AHV Turbo enabled. Configure the VM to better leverage AHV Turbo.
Note: Do not power on the VM. Configure or prepare the VM for configuration as best you can
without powering it on.
Answer:
See the
Explanation for step
by step solution.
Explanation:
To configure the VM to better leverage AHV Turbo, you can follow these steps:
Log in to Prism Element of cluster A using the credentials provided.
Go to VM > Table and select the VM named Turbo.
Click on Update and go to Hardware tab.
Increase the number of vCPUs to match the number of multiqueues that you want to enable. For
example, if you want to enable 8 multiqueues, set the vCPUs to 8. This will improve the performance
of multi-threaded workloads by allowing them to use multiple processors.
Change the SCSI Controller type from SATA to VirtIO. This will enable the use of VirtIO drivers, which
are required for AHV Turbo.
Click Save to apply the changes.
Power off the VM if it is running and mount the Nutanix VirtIO ISO image as a CD-ROM device. You
can download the ISO image from
Nutanix Portal
.
Power on the VM and install the latest Nutanix VirtIO drivers for Windows 10. You can follow the
instructions from
Nutanix Support Portal
.
After installing the drivers, power off the VM and unmount the Nutanix VirtIO ISO image.
Power on the VM and log in to Windows 10.
Open a command prompt as administrator and run the following command to enable multiqueue for
the VirtIO NIC:
ethtool -L eth0 combined 8
Replace eth0 with the name of your network interface and 8 with the number of multiqueues that
you want to enable. You can use ipconfig /all to find out your network interface name.
Restart the VM for the changes to take effect.
You have now configured the VM to better leverage AHV Turbo. You can run your stress test
application again and observe the performance gains.
https://portal.nutanix.com/page/documents/kbs/details?targetId=kA00e000000LKPdCAO
change vCPU to 2/4 ?
Change SATA Controller to SCSI:
acli vm.get Turbo
Output Example:
Turbo {
config {
agent_vm: False
allow_live_migrate: True
boot {
boot_device_order: "kCdrom"
boot_device_order: "kDisk"
boot_device_order: "kNetwork"
uefi_boot: False
}
cpu_passthrough: False
disable_branding: False
disk_list {
addr {
bus: "ide"
index: 0
}
cdrom: True
device_uuid: "994b7840-dc7b-463e-a9bb-1950d7138671"
empty: True
}
disk_list {
addr {
bus: "sata"
index: 0
}
container_id: 4
container_uuid: "49b3e1a4-4201-4a3a-8abc-447c663a2a3e"
device_uuid: "622550e4-fb91-49dd-8fc7-9e90e89a7b0e"
naa_id: "naa.6506b8dcda1de6e9ce911de7d3a22111"
storage_vdisk_uuid: "7e98a626-4cb3-47df-a1e2-8627cf90eae6"
vmdisk_size: 10737418240
vmdisk_uuid: "17e0413b-9326-4572-942f-68101f2bc716"
}
flash_mode: False
hwclock_timezone: "UTC"
machine_type: "pc"
memory_mb: 2048
name: "Turbo"
nic_list {
connected: True
mac_addr: "50:6b:8d:b2:a5:e4"
network_name: "network"
network_type: "kNativeNetwork"
network_uuid: "86a0d7ca-acfd-48db-b15c-5d654ff39096"
type: "kNormalNic"
uuid: "b9e3e127-966c-43f3-b33c-13608154c8bf"
vlan_mode: "kAccess"
}
num_cores_per_vcpu: 2
num_threads_per_core: 1
num_vcpus: 2
num_vnuma_nodes: 0
vga_console: True
vm_type: "kGuestVM"
}
is_rf1_vm: False
logical_timestamp: 2
state: "Off"
uuid: "9670901f-8c5b-4586-a699-41f0c9ab26c3"
}
acli vm.disk_create Turbo clone_from_vmdisk=17e0413b-9326-4572-942f-68101f2bc716 bus=scsi
remove the old disk
acli vm.disk_delete 17e0413b-9326-4572-942f-68101f2bc716 disk_addr=sata.0
Question 4
Task4
An administrator will be deploying Flow Networking and needs to validate that the environment,
specifically switch vs1, is appropriately configured. Only VPC traffic should be carried by the switch.
Four versions each of two possible commands have been placed in Desktop\Files\Network\flow.txt.
Remove the hash mark (#) from the front of correct First command and correct Second command
and save the file.
Only one hash mark should be removed from each section. Do not delete or copy lines, do not add
additional lines. Any changes other than removing two hash marks (#) will result in no credit.
Also, SSH directly to any AHV node (not a CVM) in the cluster and from the command line display an
overview of the Open vSwitch configuration. Copy and paste this to a new text file named
Desktop\Files\Network\AHVswitch.txt.
Note: You will not be able to use the 192.168.5.0 network in this environment.
First command
#net.update_vpc_traffic_config virtual_switch=vs0
net.update_vpc_traffic_config virtual_switch=vs1
#net.update_vpc_east_west_traffic_config virtual_switch=vs0
#net.update_vpc_east_west_traffic_config virtual_switch=vs1
Second command
#net.update_vpc_east_west_traffic_config permit_all_traffic=true
net.update_vpc_east_west_traffic_config permit_vpc_traffic=true
#net.update_vpc_east_west_traffic_config permit_all_traffic=false
#net.update_vpc_east_west_traffic_config permit_vpc_traffic=false
Answer:
See the
Explanation for step
by step solution.
Explanation:
First, you need to open the Prism Central CLI from the Windows Server 2019 workstation. You can do
this by clicking on the Start menu and typing “Prism Central CLI”. Then, you need to log in with the
credentials provided to you.
Second, you need to run the two commands that I have already given you in
Desktop\Files\Network\flow.txt. These commands are:
net.update_vpc_traffic_config
virtual_switch=vs1
net.update_vpc_east_west_traffic_config
permit_vpc_traffic=true
These commands will update the virtual switch that carries the VPC traffic to vs1, and update the
VPC east-west traffic configuration to allow only VPC traffic. You can verify that these commands
have been executed successfully by running the command:
net.get_vpc_traffic_config
This command will show you the current settings of the virtual switch and the VPC east-west traffic
configuration.
Third, you need to SSH directly to any AHV node (not a CVM) in the cluster and run the command:
ovs-vsctl show
This command will display an overview of the Open vSwitch configuration on the AHV node. You can
copy and paste the output of this command to a new text file named
Desktop\Files\Network\AHVswitch.txt.
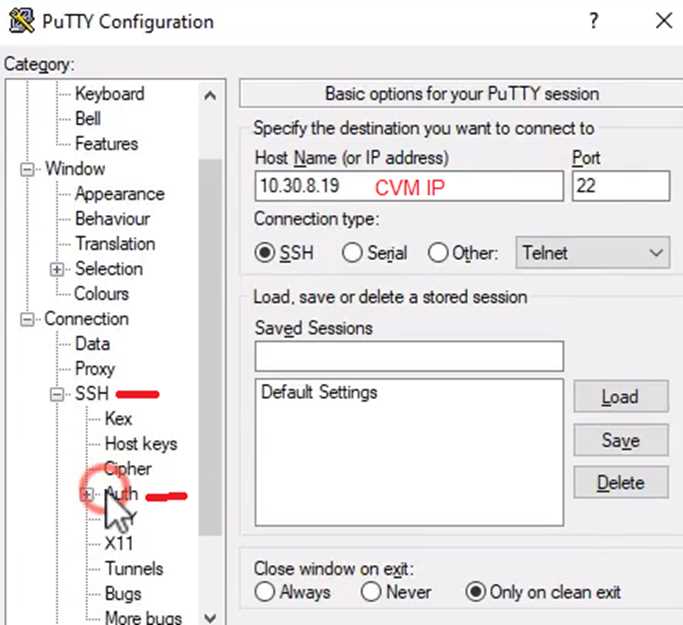
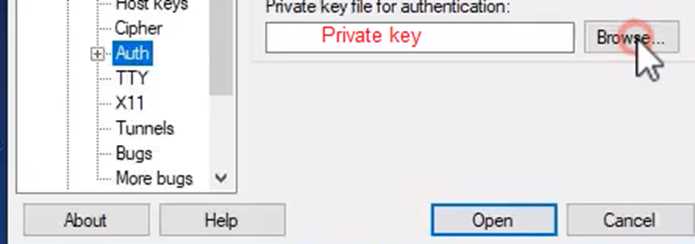
You can use any SSH client such as PuTTY or Windows PowerShell to connect to the AHV node. You
will need the IP address and the credentials of the AHV node, which you can find in Prism Element or
Prism Central.
remove # from greens
On AHV execute:
sudo ovs-vsctl show
CVM access
AHV access
command
nutanix@NTNX-A-CVM:192.168.10.5:~$ ssh [email protected] "ovs-vsctl show"
Open AHVswitch.txt and copy paste output
Question 5
Task 5
An administrator has been informed that a new workload requires a logically segmented network to
meet security requirements.
Network configuration:
VLAN: 667
Network: 192.168.0.0
Subnet Mask: 255.255.255.0
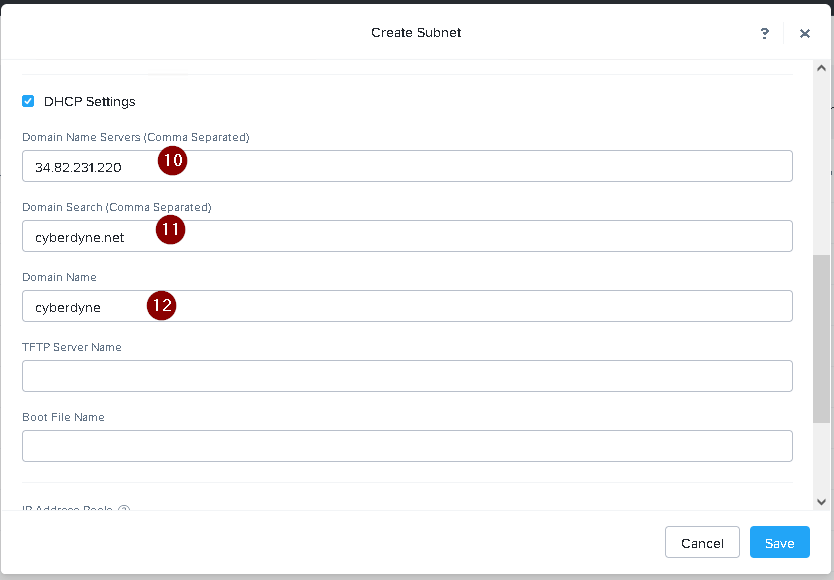
DNS server: 34.82.231.220
Default Gateway: 192.168.0.1
Domain: cyberdyne.net
IP Pool: 192.168.9.100-200
DHCP Server IP: 192.168.0.2
Configure the cluster to meet the requirements for the new workload if new objects are required,
start the name with 667.
Answer:
See the
Explanation for step
by step solution.
Explanation:
To configure the cluster to meet the requirements for the new workload, you need to do the
following steps:
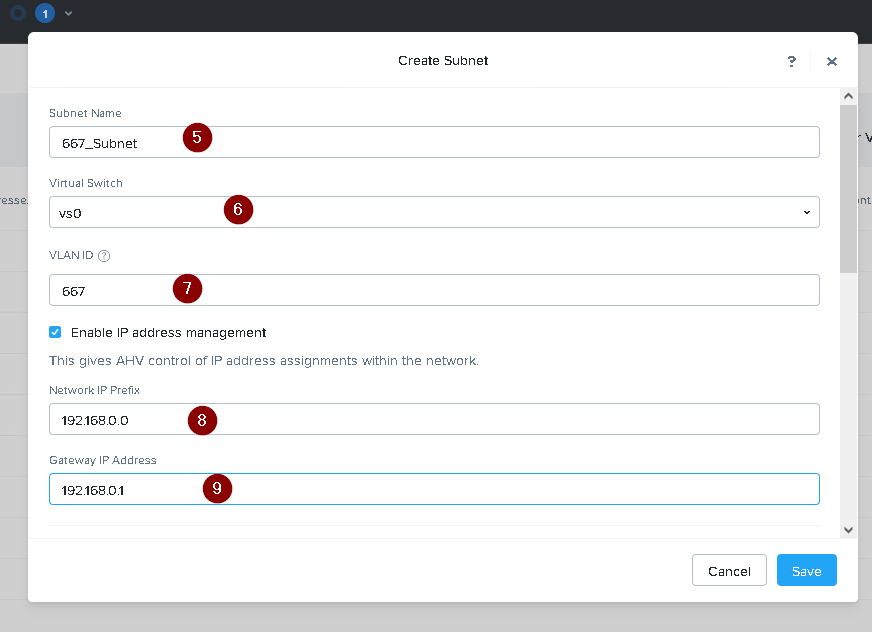
Create a new VLAN with ID 667 on the cluster. You can do this by logging in to Prism Element and
going to Network Configuration > VLANs > Create VLAN. Enter 667 as the VLAN ID and a name for the
VLAN, such as 667_VLAN.
Create a new network segment with the network details provided. You can do this by logging in to
Prism Central and going to Network > Network Segments > Create Network Segment. Enter a name
for the network segment, such as 667_Network_Segment, and select 667_VLAN as the VLAN. Enter
192.168.0.0 as the Network Address and 255.255.255.0 as the Subnet Mask. Enter 192.168.0.1 as the
Default Gateway and 34.82.231.220 as the DNS Server. Enter cyberdyne.net as the Domain Name.
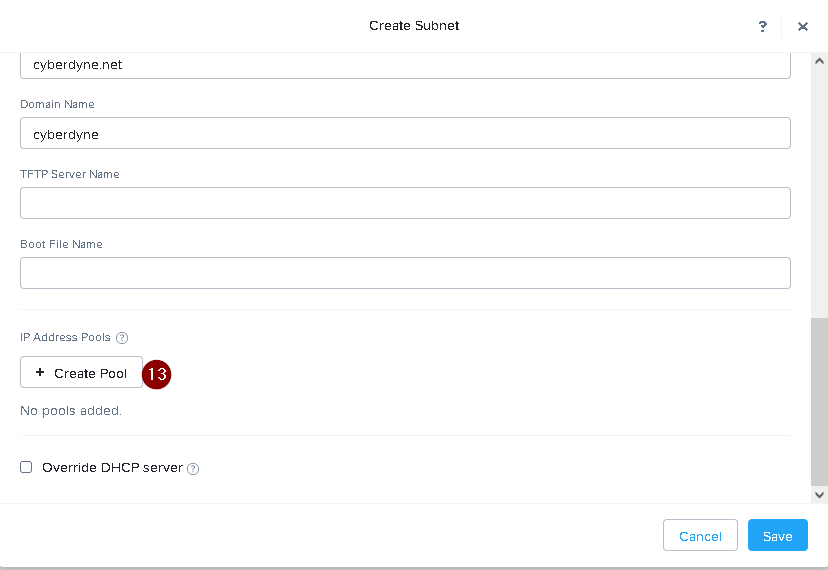
Create a new IP pool with the IP range provided. You can do this by logging in to Prism Central and
going to Network > IP Pools > Create IP Pool. Enter a name for the IP pool, such as 667_IP_Pool, and
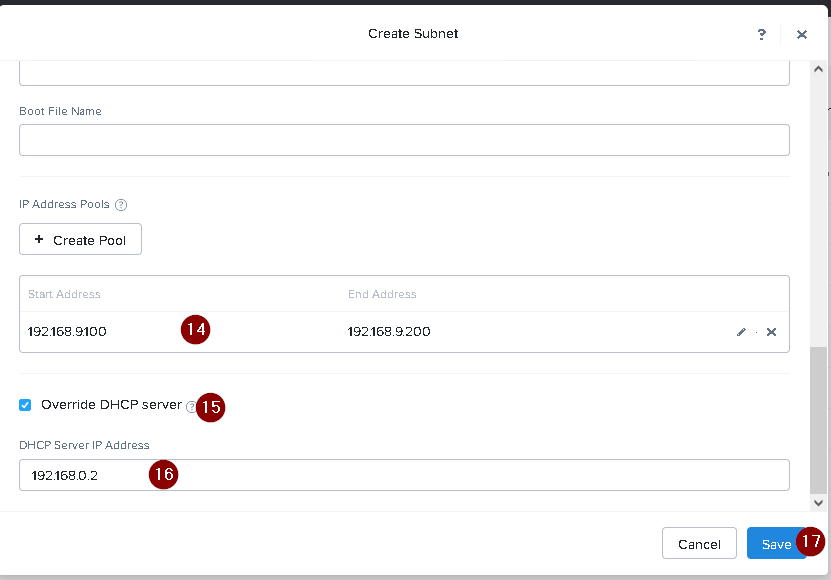
select 667_Network_Segment as the Network Segment. Enter 192.168.9.100 as the Starting IP
Address and 192.168.9.200 as the Ending IP Address.
Configure the DHCP server with the IP address provided. You can do this by logging in to Prism
Central and going to Network > DHCP Servers > Create DHCP Server. Enter a name for the DHCP
server, such as 667_DHCP_Server, and select 667_Network_Segment as the Network Segment. Enter
192.168.0.2 as the IP Address and select 667_IP_Pool as the IP Pool.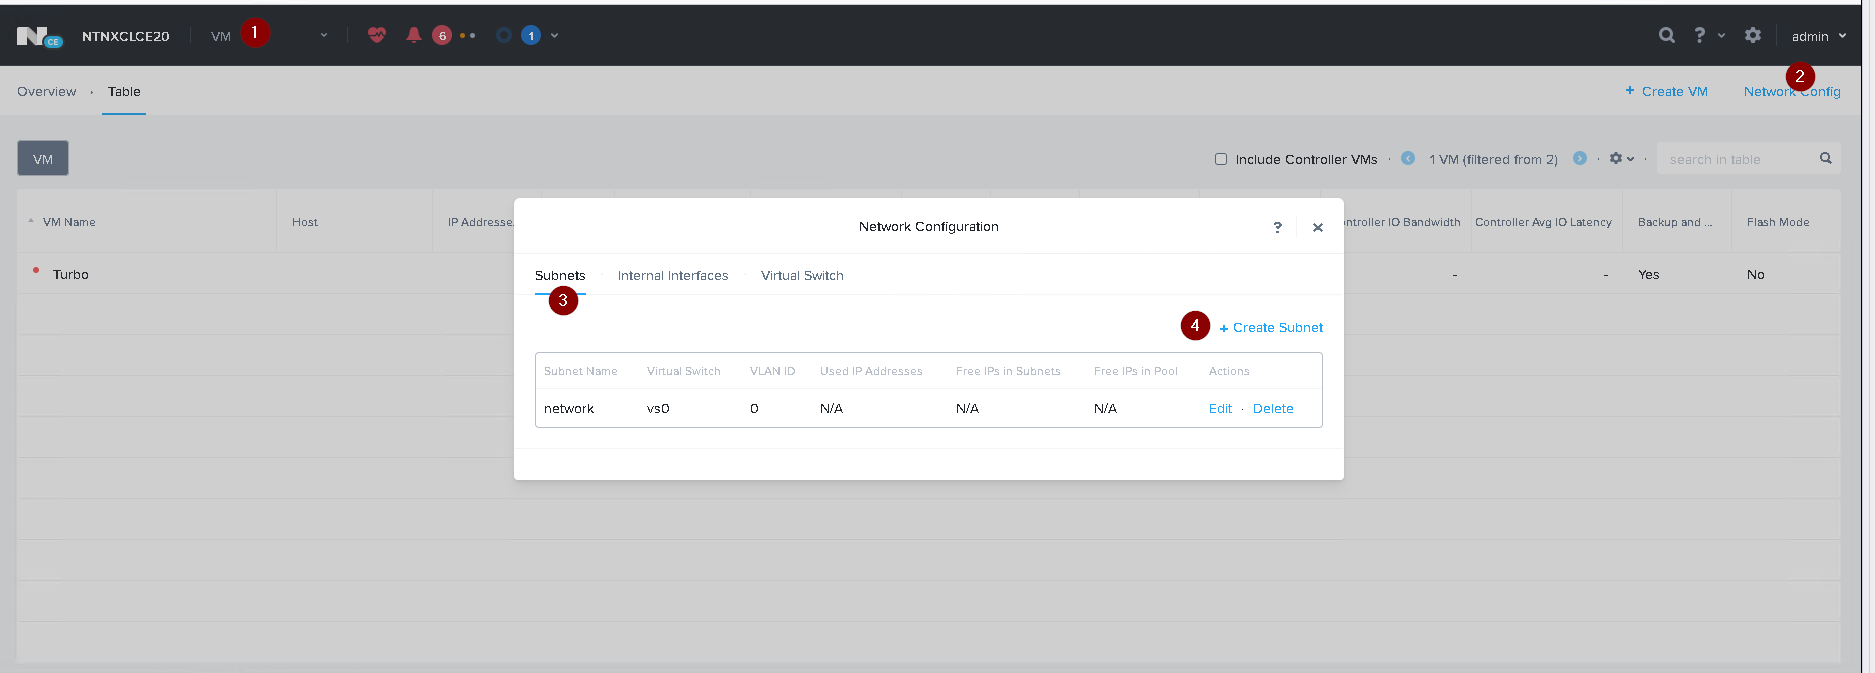
Question 6
Task 6
An administrator has requested the commands needed to configure traffic segmentation on an
unconfigured node. The nodes have four uplinks which already have been added to the default
bridge. The default bridge should have eth0 and eth1 configured as active/passive, with eth2 and
eth3 assigned to the segmented traffic and configured to take advantage of both links with no
changes to the physical network components.
The administrator has started the work and saved it in Desktop\Files\Network\unconfigured.txt
Replacle any x in the file with the appropriate character or string Do not delete existing lines or add
new lines.
Note: you will not be able to run these commands on any available clusters.
Unconfigured.txt
manage_ovs --bond_name brX-up --bond_mode xxxxxxxxxxx --interfaces ethX,ethX update_uplinks
manage_ovs --bridge_name brX-up --interfaces ethX,ethX --bond_name bond1 --bond_mode
xxxxxxxxxxx update_uplinks
Answer:
See the
Explanation for step
by step solution.
Explanation:
To configure traffic segmentation on an unconfigured node, you need to run the following commands
on the node:
manage_ovs --bond_name br0-up --bond_mode active-backup --interfaces eth0,eth1 update_uplinks
manage_ovs --bridge_name br0-up --interfaces eth2,eth3 --bond_name bond1 --bond_mode
balance-slb update_uplinks
These commands will create a bond named br0-up with eth0 and eth1 as active and passive
interfaces, and assign it to the default bridge. Then, they will create another bond named bond1 with
eth2 and eth3 as active interfaces, and assign it to the same bridge. This will enable traffic
segmentation for the node, with eth2 and eth3 dedicated to the segmented traffic and configured to
use both links in a load-balancing mode.
I have replaced the x in the file Desktop\Files\Network\unconfigured.txt with the appropriate
character or string for you. You can find the updated file in Desktop\Files\Network\configured.txt.
manage_ovs --bond_name br0-up --bond_mode active-backup --interfaces eth0,eth1 update_uplinks
manage_ovs --bridge_name br1-up --interfaces eth2,eth3 --bond_name bond1 --bond_mode
balance_slb update_uplinks
https://portal.nutanix.com/page/documents/solutions/details?targetId=BP-2071-AHV-Networking:ovs-command-line-configuration.html
Question 7
Task 7
An administrator has environment that will soon be upgraded to 6.5. In the meantime, they need to
implement log and apply a security policy named Staging_Production, such that not VM in the
Staging Environment can communicate with any VM in the production Environment,
Configure the environment to satisfy this requirement.
Note: All other configurations not indicated must be left at their default values.
Answer:
See the
Explanation for step
by step solution.
Explanation:
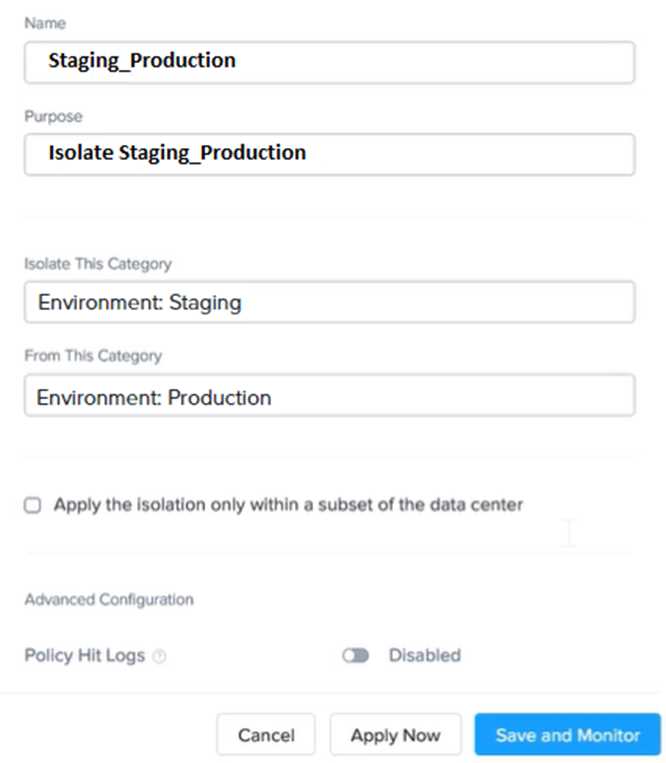
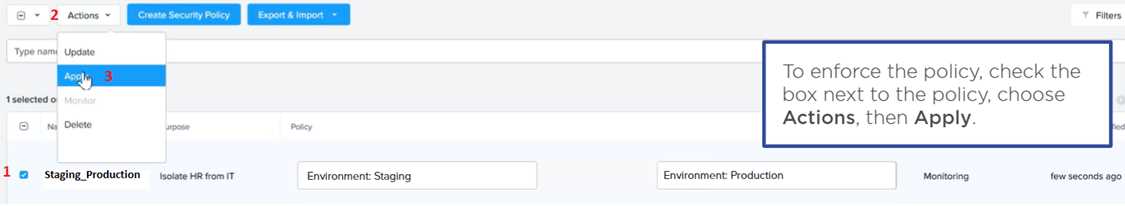
To configure the environment to satisfy the requirement of implementing a security policy named
Staging_Production, such that no VM in the Staging Environment can communicate with any VM in
the production Environment, you need to do the following steps:
Log in to Prism Central and go to Network > Security Policies > Create Security Policy. Enter
Staging_Production as the name of the security policy and select Cluster A as the cluster.
In the Scope section, select VMs as the entity type and add the VMs that belong to the Staging
Environment and the Production Environment as the entities. You can use tags or categories to filter
the VMs based on their environment.
In the Rules section, create a new rule with the following settings:
Direction: Bidirectional
Protocol: Any
Source: Staging Environment
Destination: Production Environment
Action: Deny
Save the security policy and apply it to the cluster.
This will create a security policy that will block any traffic between the VMs in the Staging
Environment and the VMs in the Production Environment. You can verify that the security policy is
working by trying to ping or access any VM in the Production Environment from any VM in the
Staging Environment, or vice vers
a. You should not be able to do so.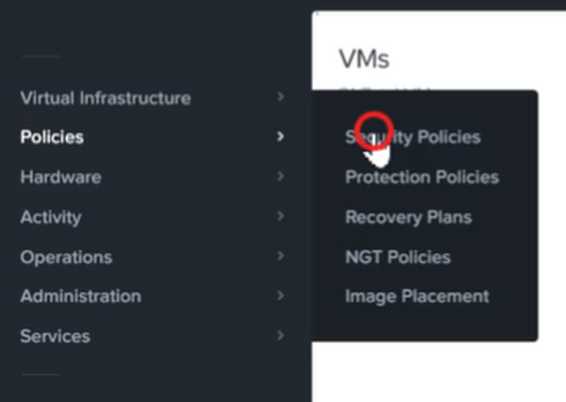

Question 8
Task 8
Depending on the order you perform the exam items, the access information and credentials could
change. Please refer to the other item performed on Cluster B if you have problems accessing the
cluster.
The infosec team has requested that audit logs for API Requests and replication capabilities be
enabled for all clusters for the top 4 severity levels and pushed to their syslog system using highest
reliability possible. They have requested no other logs to be included.
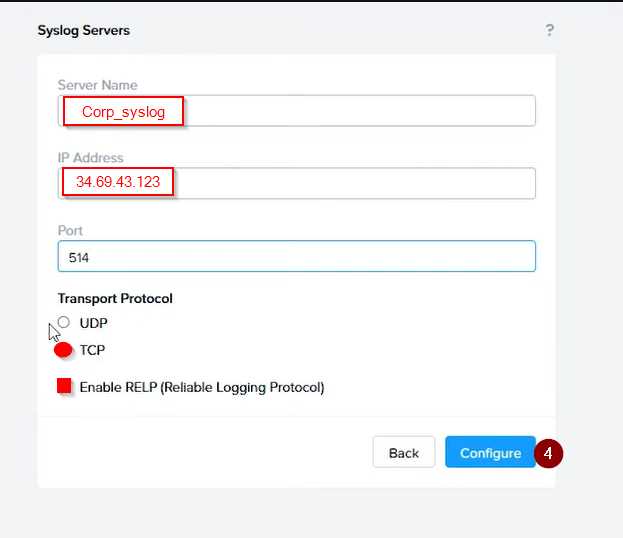
Syslog configuration:
Syslog Name: Corp_syslog
Syslop IP: 34.69.43.123
Port: 514
Ensure the cluster is configured to meet these requirements.
Answer:
See the
Explanation for step
by step solution.
Explanation:
To configure the cluster to meet the requirements of the infosec team, you need to do the following
steps:
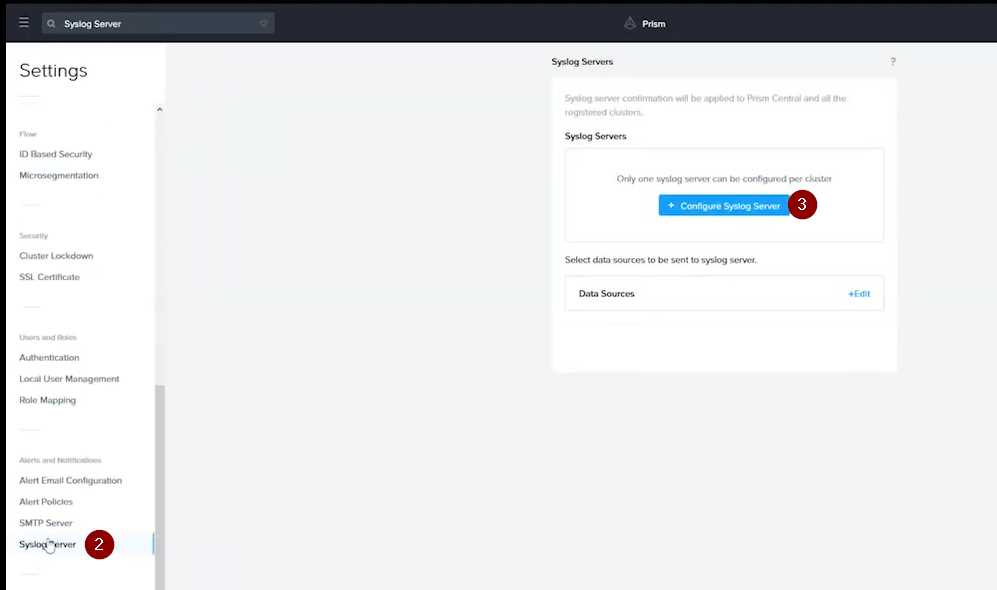
Log in to Prism Central and go to Network > Syslog Servers > Configure Syslog Server. Enter
Corp_syslog as the Server Name, 34.69.43.123 as the IP Address, and 514 as the Port. Select TCP as
the Transport Protocol and enable RELP (Reliable Logging Protocol). This will create a syslog server
with the highest reliability possible.
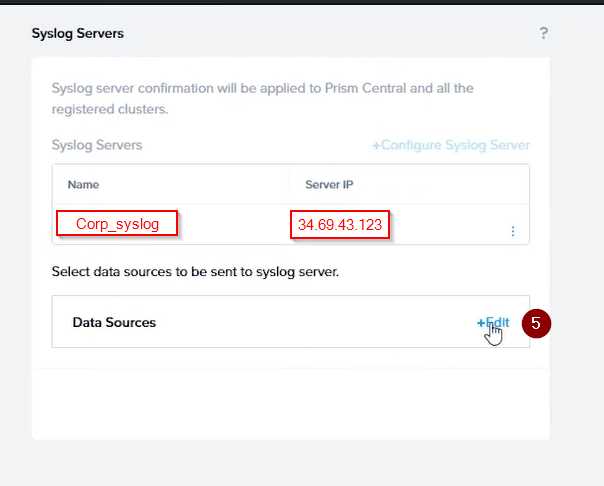
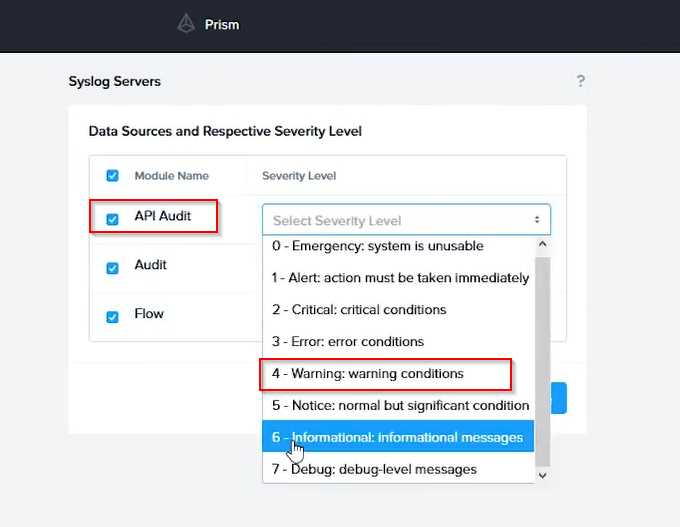
Click Edit against Data Sources and select Cluster B as the cluster. Select API Requests and Replication
as the data sources and set the log level to CRITICAL for both of them. This will enable audit logs for
API requests and replication capabilities for the top 4 severity levels (EMERGENCY, ALERT, CRITICAL,
and ERROR) and push them to the syslog server. Click Save.
Repeat step 2 for any other clusters that you want to configure with the same requirements.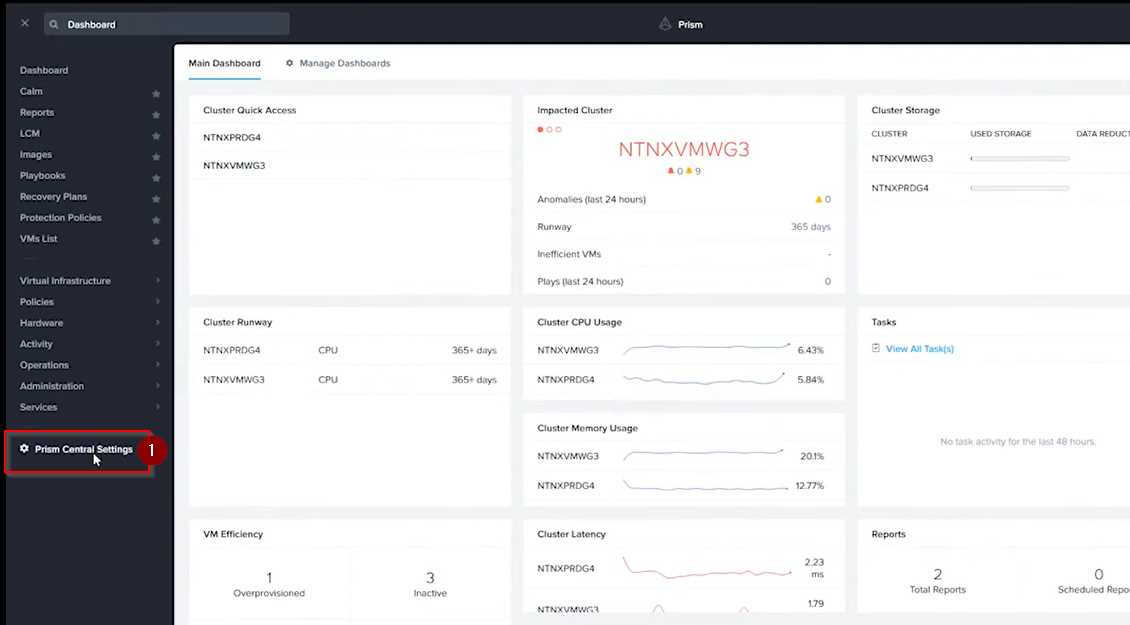
To configure the Nutanix clusters to enable audit logs for API Requests and replication capabilities,
and push them to the syslog system with the highest reliability possible, you can follow these steps:
Log in to the Nutanix Prism web console using your administrator credentials.
Navigate to the "Settings" section or the configuration settings interface within Prism.
Locate the "Syslog Configuration" or "Logging" option and click on it.
Configure the syslog settings as follows:
Syslog Name: Enter "Corp_syslog" as the name for the syslog configuration.
Syslog IP: Set the IP address to "34.69.43.123", which is the IP address of the syslog system.
Port: Set the port to "514", which is the default port for syslog.
Enable the option for highest reliability or persistent logging, if available. This ensures that logs are
sent reliably and not lost in case of network interruptions.
Save the syslog configuration.
Enable Audit Logs for API Requests:
In the Nutanix Prism web console, navigate to the "Cluster" section or the cluster management
interface.
Select the desired cluster where you want to enable audit logs.
Locate the "Audit Configuration" or "Security Configuration" option and click on it.
Look for the settings related to audit logs and API requests. Enable the audit logging feature and
select the top 4 severity levels to be logged.
Save the audit configuration.
Enable Audit Logs for Replication Capabilities:
In the Nutanix Prism web console, navigate to the "Cluster" section or the cluster management
interface.
Select the desired cluster where you want to enable audit logs.
Locate the "Audit Configuration" or "Security Configuration" option and click on it.
Look for the settings related to audit logs and replication capabilities. Enable the audit logging
feature and select the top 4 severity levels to be logged.
Save the audit configuration.
After completing these steps, the Nutanix clusters will be configured to enable audit logs for API
Requests and replication capabilities. The logs will be sent to the specified syslog system with the
highest reliability possible.
ncli
<ncli> rsyslog-config set-status enable=false
<ncli> rsyslog-config add-server name=Corp_Syslog ip-address=34.69.43.123 port=514 network-
protocol=tdp relp-enabled=false
<ncli> rsyslog-config add-module server-name= Corp_Syslog module-name=APLOS level=INFO
<ncli> rsyslog-config add-module server-name= Corp_Syslog module-name=CEREBRO level=INFO
<ncli> rsyslog-config set-status enable=true
https://portal.nutanix.com/page/documents/kbs/details?targetId=kA00e0000009CEECA2
Question 9
Task 9
Part1
An administrator logs into Prism Element and sees an alert stating the following:
Cluster services down on Controller VM (35.197.75.196)
Correct this issue in the least disruptive manner.
Part2
In a separate request, the security team has noticed a newly created cluster is reporting.
CVM [35.197.75.196] is using the default password.
They have provided some new security requirements for cluster level security.
Security requirements:
Update the default password for the root user on the node to match the admin user password: Note:
192.168.x.x is not available. To access a node use the Host IP (172.30.0.x) from a CVM or the supplied
external IP address.
Update the default password for the nutanix user on the CVM to match the admin user password.
Resolve the alert that is being reported.
Output the cluster-wide configuration of the SCMA policy to Desktop\Files\output.txt before changes
are made.
Enable the Advance intrusion Detection Environment (AIDE) to run on a weekly basis for the cluster.
Enable high-strength password policies for the cluster.
Ensure CVMs require SSH keys for login instead of passwords. (SSH keys are located in the
Desktop\Files\SSH folder).
Ensure the clusters meets these requirements. Do not reboot any cluster components.
Answer:
See the
Explanation for step
by step solution.
Explanation:
To correct the issue of cluster services down on Controller VM (35.197.75.196) in the least disruptive
manner, you need to do the following steps:
Log in to Prism Element using the admin user credentials.
Go to the Alerts page and click on the alert to see more details.
You will see which cluster services are down on the Controller VM. For example, it could be
cassandra, curator, stargate, etc.
To start the cluster services, you need to SSH to the Controller VM using the nutanix user credentials.
You can use any SSH client such as PuTTY or Windows PowerShell to connect to the Controller VM.
You will need the IP address and the password of the nutanix user, which you can find in
Desktop\Files\SSH\nutanix.txt.
Once you are logged in to the Controller VM, run the command:
cluster status | grep -v UP
This will show you which services are down on the Controller VM.
To start the cluster services, run the command:
cluster start
This will start all the cluster services on the Controller VM.
To verify that the cluster services are running, run the command:
cluster status | grep -v UP
This should show no output, indicating that all services are up.
To clear the alert, go back to Prism Element and click on Resolve in the Alerts page.
To meet the security requirements for cluster level security, you need to do the following steps:
To update the default password for the root user on the node to match the admin user password, you
need to SSH to the node using the root user credentials. You can use any SSH client such as PuTTY or
Windows PowerShell to connect to the node. You will need the IP address and the password of the
root user, which you can find in Desktop\Files\SSH\root.txt.
Once you are logged in to the node, run the command:
passwd
This will prompt you to enter a new password for the root user. Enter the same password as the
admin user, which you can find in Desktop\Files\SSH\admin.txt.
To update the default password for the nutanix user on the CVM to match the admin user password,
you need to SSH to the CVM using the nutanix user credentials. You can use any SSH client such as
PuTTY or Windows PowerShell to connect to the CVM. You will need the IP address and the password
of the nutanix user, which you can find in Desktop\Files\SSH\nutanix.txt.
Once you are logged in to the CVM, run the command:
passwd
This will prompt you to enter a new password for the nutanix user. Enter the same password as the
admin user, which you can find in Desktop\Files\SSH\admin.txt.
To resolve the alert that is being reported, go back to Prism Element and click on Resolve in the
Alerts page.
To output the cluster-wide configuration of SCMA policy to Desktop\Files\output.txt before changes
are made, you need to log in to Prism Element using the admin user credentials.
Go to Security > SCMA Policy and click on View Policy Details. This will show you the current settings
of SCMA policy for each entity type.
Copy and paste these settings into a new text file named Desktop\Files\output.txt.
To enable AIDE (Advanced Intrusion Detection Environment) to run on a weekly basis for the cluster,
you need to log in to Prism Element using the admin user credentials.
Go to Security > AIDE Configuration and click on Enable AIDE. This will enable AIDE to monitor file
system changes on all CVMs and nodes in the cluster.
Select Weekly as the frequency of AIDE scans and click Save.
To enable high-strength password policies for the cluster, you need to log in to Prism Element using
the admin user credentials.
Go to Security > Password Policy and click on Edit Policy. This will allow you to modify the password
policy settings for each entity type.
For each entity type (Admin User, Console User, CVM User, and Host User), select High Strength as
the password policy level and click Save.
To ensure CVMs require SSH keys for login instead of passwords, you need to log in to Prism Element
using the admin user credentials.
Go to Security > Cluster Lockdown and click on Configure Lockdown. This will allow you to manage
SSH access settings for the cluster.
Uncheck Enable Remote Login with Password. This will disable password-based SSH access to the
cluster.
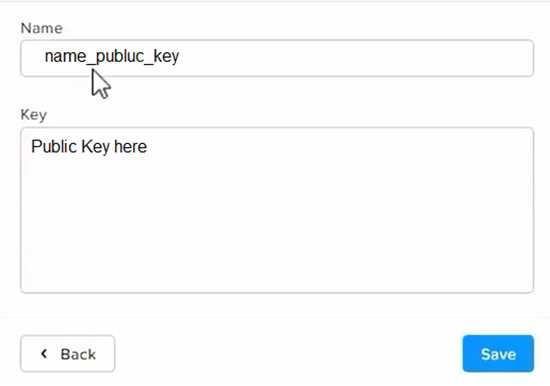
Click New Public Key and enter a name for the key and paste the public key value from
Desktop\Files\SSH\id_rsa.pub. This will add a public key for key-based SSH access to the cluster.
Click Save and Apply Lockdown. This will apply the changes and ensure CVMs require SSH keys for
login instead of passwords.
Part1
Enter CVM ssh and execute:
cluster status | grep -v UP
cluster start
If there are issues starting some services, check the following:
Check if the node is in maintenance mode by running the ncli host ls command on the CVM. Verify if
the parameter Under Maintenance Mode is set to False for the node where the services are down. If
the parameter Under Maintenance Mode is set to True, remove the node from maintenance mode
by running the following command:
nutanix@cvm$ ncli host edit id=<host id> enable-maintenance-mode=false
You can determine the host ID by using ncli host ls.
See the troubleshooting topics related to failed cluster services in the Advanced Administration
Guide available from the Nutanix Portal's
Software Documentation
page. (Use the filters to search for
the guide for your AOS version). These topics have information about common and AOS-specific logs,
such as Stargate, Cassandra, and other modules.
Check for any latest FATALs for the service that is down. The following command prints all the FATALs
for a CVM. Run this command on all CVMs.
nutanix@cvm$ for i in `svmips`; do echo "CVM: $i"; ssh $i "ls -ltr /home/nutanix/data/logs/*.FATAL";
done
NCC Health Check: cluster_services_down_check (nutanix.com)
Part2
Update the default password for the root user on the node to match the admin user password
echo -e "CHANGING ALL AHV HOST ROOT PASSWORDS.\nPlease input new password: "; read -rs
password1; echo "Confirm new password: "; read -rs password2; if [ "$password1" == "$password2"
]; then for host in $(hostips); do echo Host $host; echo $password1 | ssh root@$host "passwd --stdin
root"; done; else echo "The passwords do not match"; fi
Update the default password for the nutanix user on the CVM
sudo passwd nutanix
Output the cluster-wide configuration of the SCMA policy
ncli cluster get-hypervisor-security-config
Output Example:
nutanix@NTNX-372a19a3-A-CVM:10.35.150.184:~$ ncli cluster get-hypervisor-security-config
Enable Aide
: false
Enable Core
: false
Enable High Strength P... : false
Enable Banner
: false
Schedule
: DAILY
Enable iTLB Multihit M... : false
Enable the Advance intrusion Detection Environment (AIDE) to run on a weekly basis for the cluster.
ncli cluster edit-hypervisor-security-params enable-aide=true
ncli cluster edit-hypervisor-security-params schedule=weekly
Enable high-strength password policies for the cluster.
ncli cluster edit-hypervisor-security-params enable-high-strength-password=true
Ensure CVMs require SSH keys for login instead of passwords
https://portal.nutanix.com/page/documents/kbs/details?targetId=kA0600000008gb3CAA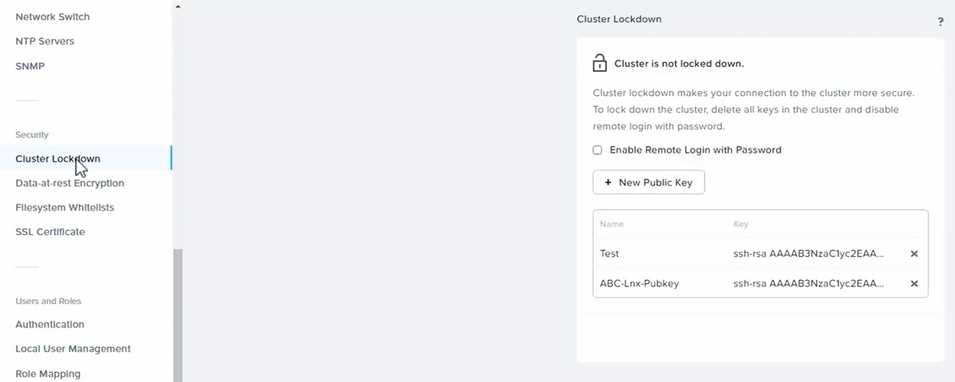
Question 10
Task 10
An administrator is working to create a VM using Nutanix V3 API calls with the following
specifications.
* VM specifications:
* vCPUs: 2
* Memory: BGb
* Disk Size: 50Gb
* Cluster: Cluster A
* Network: default- net
The API call is falling, indicating an issue with the payload:
The body is saved in Desktop/ Files/API_Create_VM,text
Correct any issues in the text file that would prevent from creating the VM. Also ensure the VM will
be created as speeded and make sure it is saved for re-use using that filename.
Deploy the vm through the API
Note: Do not power on the VM.
Answer:
See the
Explanation for step
by step solution.
Explanation:
https://portal.nutanix.com/page/documents/kbs/details?targetId=kA00e000000LLEzCAO
https://jsonformatter.curiousconcept.com/#
acli net.list (uuid network defult_net)
ncli cluster info (uuid cluster)
Put Call: https://Prism Central IP address : 9440/api/nutanix/v3vms
Edit these lines to fix the API call, do not add new lines or copy lines.
You can test using the Prism Element API explorer or PostMan
Body:
{
{
"spec": {
"name": "Test_Deploy",
"resources": {
"power_state":"OFF",
"num_vcpus_per_socket": ,
"num_sockets": 1,
"memory_size_mib": 8192,
"disk_list": [
{
"disk_size_mib": 51200,
"device_properties": {
"device_type":"DISK"
}
},
{
"device_properties": {
"device_type":"CDROM"
}
}
],
"nic_list":[
{
"nic_type": "NORMAL_NIC",
"is_connected": true,
"ip_endpoint_list": [
{
"ip_type": "DHCP"
}
],
"subnet_reference": {
"kind": "subnet",
"name": "default_net",
"uuid": "00000000-0000-0000-0000-000000000000"
}
}
],
},
"cluster_reference": {
"kind": "cluster",
"name": "NTNXDemo",
"uuid": "00000000-0000-0000-0000-000000000000"
}
},
"api_version": "3.1.0",
"metadata": {
"kind": "vm"
}
}
https://www.nutanix.dev/2019/08/26/post-a-package-building-your-first-nutanix-rest-api-post-
request/
Reference
Question 11
Task 11
An administrator has noticed that after a host failure, the SQL03 VM was not powered back on from
another host within the cluster. The Other SQL VMs (SQL01, SQL02) have recovered properly in the
past.
Resolve the issue and configure the environment to ensure any single host failure affects a minimal
number os SQL VMs.
Note: Do not power on any VMs
Answer:
See the
Explanation for step
by step solution.
Explanation:
One possible reason why the SQL03 VM was not powered back on after a host failure is that the
cluster was configured with the default (best effort) VM high availability mode, which does not
guarantee the availability of VMs in case of insufficient resources on the remaining hosts. To resolve
this issue, I suggest changing the VM high availability mode to guarantee (reserved segments), which
reserves some memory on each host for failover of VMs from a failed host. This way, the SQL03 VM
will have a higher chance of being restarted on another host in case of a host failure.
To change the VM high availability mode to guarantee (reserved segments), you can follow these
steps:
Log in to Prism Central and select the cluster where the SQL VMs are running.
Click on the gear icon on the top right corner and select Cluster Settings.
Under Cluster Services, click on Virtual Machine High Availability.
Select Guarantee (Reserved Segments) from the drop-down menu and click Save.
To configure the environment to ensure any single host failure affects a minimal number of SQL VMs,
I suggest using anti-affinity rules, which prevent VMs that belong to the same group from running on
the same host. This way, if one host fails, only one SQL VM will be affected and the other SQL VMs
will continue running on different hosts.
To create an anti-affinity rule for the SQL VMs, you can follow these steps:
Log in to Prism Central and click on Entities on the left menu.
Select Virtual Machines from the drop-down menu and click on Create Group.
Enter a name for the group, such as SQL Group, and click Next.
Select the SQL VMs (SQL01, SQL02, SQL03) from the list and click Next.
Select Anti-Affinity from the drop-down menu and click Next.
Review the group details and click Finish.
I hope this helps. How else can I help?
https://portal.nutanix.com/page/documents/details?targetId=AHV-Admin-Guide-v6_5:ahv-affinity-policies-c.html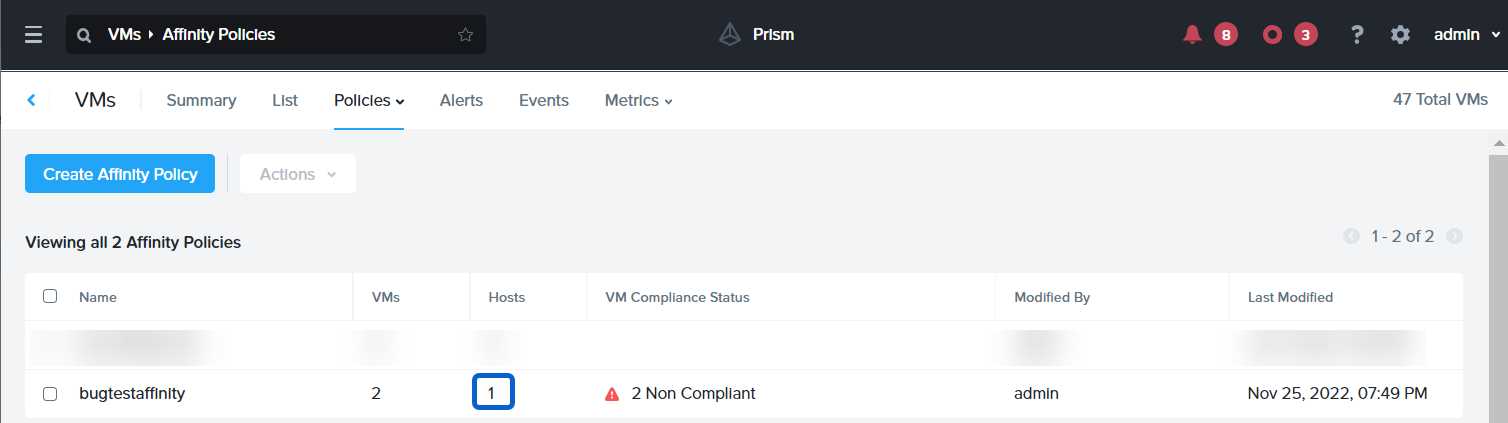
Question 12
Task 12
An administrator needs to create a report named VMs_Power_State that lists the VMs in the cluster
and their basic details including the power state for the last month.
No other entities should be included in the report.
The report should run monthly and should send an email to
[email protected]
when it runs.
Generate an instance of the report named VMs_Power_State as a CSV and save the zip file as
Desktop\Files\VMs_Power_state.zip
Note: Make sure the report and zip file are named correctly. The SMTP server will not be configured.
Answer:
See the
Explanation for step
by step solution.
Explanation:
To create a report named VMs_Power_State that lists the VMs in the cluster and their basic details
including the power state for the last month, you can follow these steps:
Log in to Prism Central and click on Entities on the left menu.
Select Virtual Machines from the drop-down menu and click on Create Report.
Enter VMs_Power_State as the report name and a description if required. Click Next.
Under the Custom Views section, select Data Table. Click Next.
Under the Entity Type option, select VM. Click Next.
Under the Custom Columns option, add the following variables: Name, Cluster Name, vCPUs,
Memory, Power State. Click Next.
Under the Time Period option, select Last Month. Click Next.
Under the Report Settings option, select Monthly from the Schedule drop-down menu. Enter
[email protected] as the Email Recipient. Select CSV as the Report Output Format. Click Next.
Review the report details and click Finish.
To generate an instance of the report named VMs_Power_State as a CSV and save the zip file as
Desktop\Files\VMs_Power_state.zip, you can follow these steps:
Log in to Prism Central and click on Operations on the left menu.
Select Reports from the drop-down menu and find the VMs_Power_State report from the list. Click
on Run Now.
Wait for the report to be generated and click on Download Report. Save the file as
Desktop\Files\VMs_Power_state.zip.
1.
Open the Report section on Prism Central (Operations > Reports)
2.
Click on the New Report button to start the creation of your custom report
3.
Under the Custom Views section, select Data Table
4.
Provide a title to your custom report, as well as a description if required.
5.
Under the Entity Type option, select VM
6.
This report can include all as well as a selection of the VMs
7.
Click on the Custom Columns option and add the below variables:
a.
Name - Name of the listed Virtual Machine
b.
vCPUs - A combination of the vCores and vCPU's assigned to the Virtual Machine
c.
Memory - Amount of memory assigned to the Virtual Machine
d.
Disk Capacity - The total amount of assigned virtual disk capacity
e.
Disk Usage - The total used virtual disk capacity
f.
Snapshot Usage - The total amount of capacity used by snapshots (Excluding Protection
Domain snapshots)
8.
Under the Aggregation option for Memory and Disk Usage accept the default Average option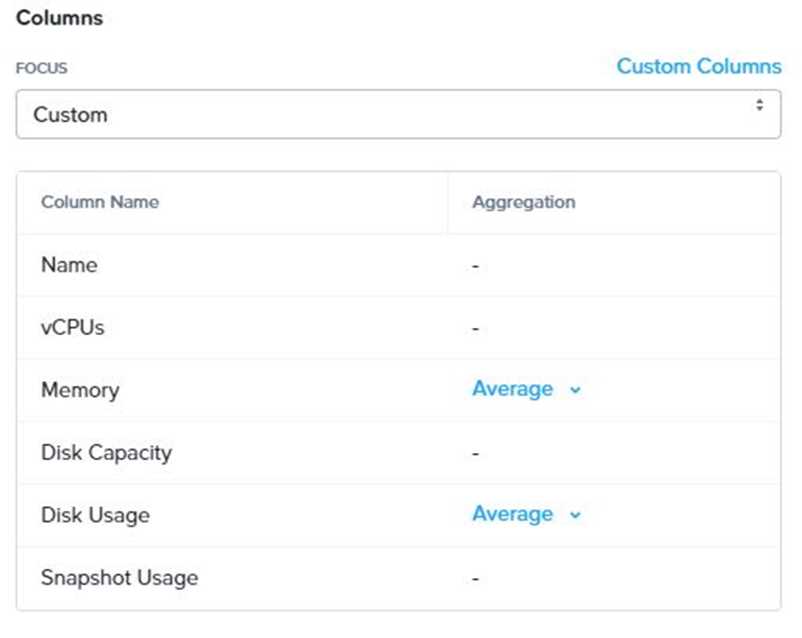
9.
Click on the Add button to add this custom selection to your report
10.
Next click on the Save and Run Now button on the bottom right of the screen
11.
Provide the relevant details on this screen for your custom report: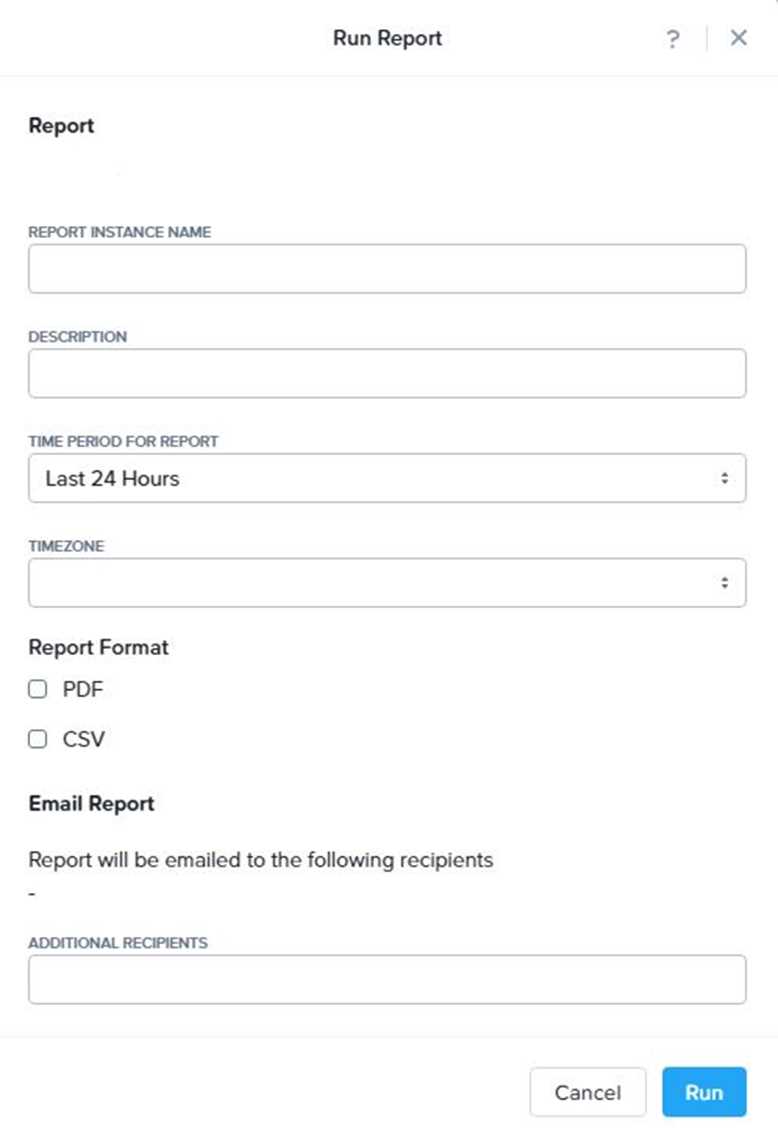
12.
You can leave the Time Period For Report variable at the default of Last 24 Hours
13.
Specify a report output of preference (PDF or CSV) and if required Additional Recipients for
this report to be mailed to. The report can also simply be downloaded after this creation and initial
run if required
14.
Below is an example of this report in a CSV format:
Question 13
Task 13
The application team is reporting performance degradation for a business-critical application that
runs processes all day on Saturdays.
The team is requesting monitoring or processor, memory and storage utilization for the three VMs
that make up the database cluster for the application: ORA01, ORA02 and ORA03.
The report should contain tables for the following:
At the cluster level, only for the current cluster:
The maximum percentage of CPU used
At the VM level, including any future VM with the prefix ORA:
The maximum time taken to process I/O Read requests
The Maximum percentage of time a VM waits to use physical CPU, out of the local CPU time allotted
to the VM.
The report should run on Sundays at 12:00 AM for the previous 24 hours. The report should be
emailed to
[email protected]
when competed.
Create a report named Weekends that meets these requirements
Note: You must name the report Weekends to receive any credit. Any other objects needed can be
named as you see fit. SMTP is not configured.
Answer:
See the
Explanation for step
by step solution.
Explanation:
To create a report named Weekends that meets the requirements, you can follow these steps:
Log in to Prism Central and click on Entities on the left menu.
Select Virtual Machines from the drop-down menu and click on Create Report.
Enter Weekends as the report name and a description if required. Click Next.
Under the Custom Views section, select Data Table. Click Next.
Under the Entity Type option, select Cluster. Click Next.
Under the Custom Columns option, add the following variable: CPU Usage (%). Click Next.
Under the Aggregation option for CPU Usage (%), select Max. Click Next.
Under the Filter option, select Current Cluster from the drop-down menu. Click Next.
Click on Add to add this custom view to your report. Click Next.
Under the Custom Views section, select Data Table again. Click Next.
Under the Entity Type option, select VM. Click Next.
Under the Custom Columns option, add the following variables: Name, I/O Read Latency (ms), VM
Ready Time (%). Click Next.
Under the Aggregation option for I/O Read Latency (ms) and VM Ready Time (%), select Max. Click
Next.
Under the Filter option, enter ORA* in the Name field. This will include any future VM with the prefix
OR
A. Click Next.
Click on Add to add this custom view to your report. Click Next.
Under the Report Settings option, select Weekly from the Schedule drop-down menu and choose
Sunday as the day of week. Enter 12:00 AM as the time of day. Enter [email protected] as the
Email Recipient. Select CSV as the Report Output Format. Click Next.
Review the report details and click Finish.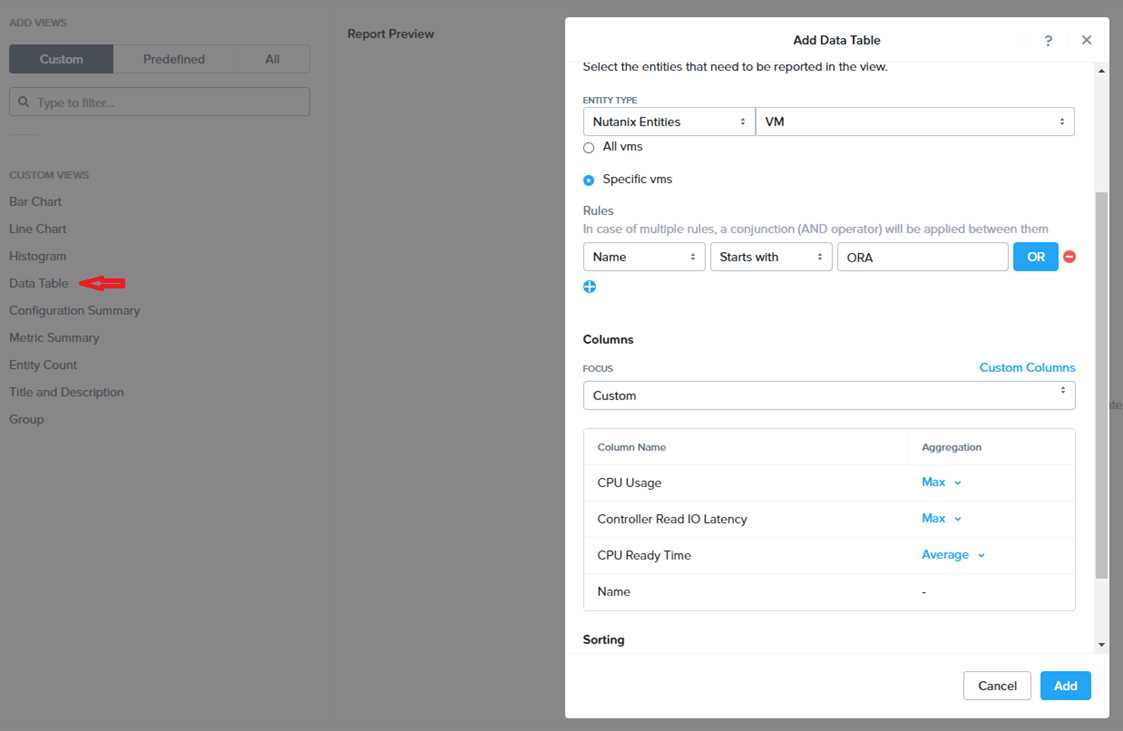
Question 14
Task 14
The application team has requested several mission-critical VMs to be configured for disaster
recovery. The remote site (when added) will not be managed by Prism Central. As such, this solution
should be built using the Web Console.
Disaster Recovery requirements per VM:
Mkt01
RPO: 2 hours
Retention: 5 snapshots
Fin01
RPO: 15 minutes
Retention: 7 days
Dev01
RPO: 1 day
Retention: 2 snapshots
Configure a DR solution that meets the stated requirements.
Any objects created in this item must start with the name of the VM being protected.
Note: the remote site will be added later
Answer:
See the
Explanation for step
by step solution.
Explanation:
To configure a DR solution that meets the stated requirements, you can follow these steps:
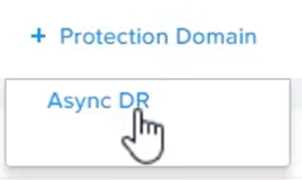
Log in to the Web Console of the source cluster where the VMs are running.
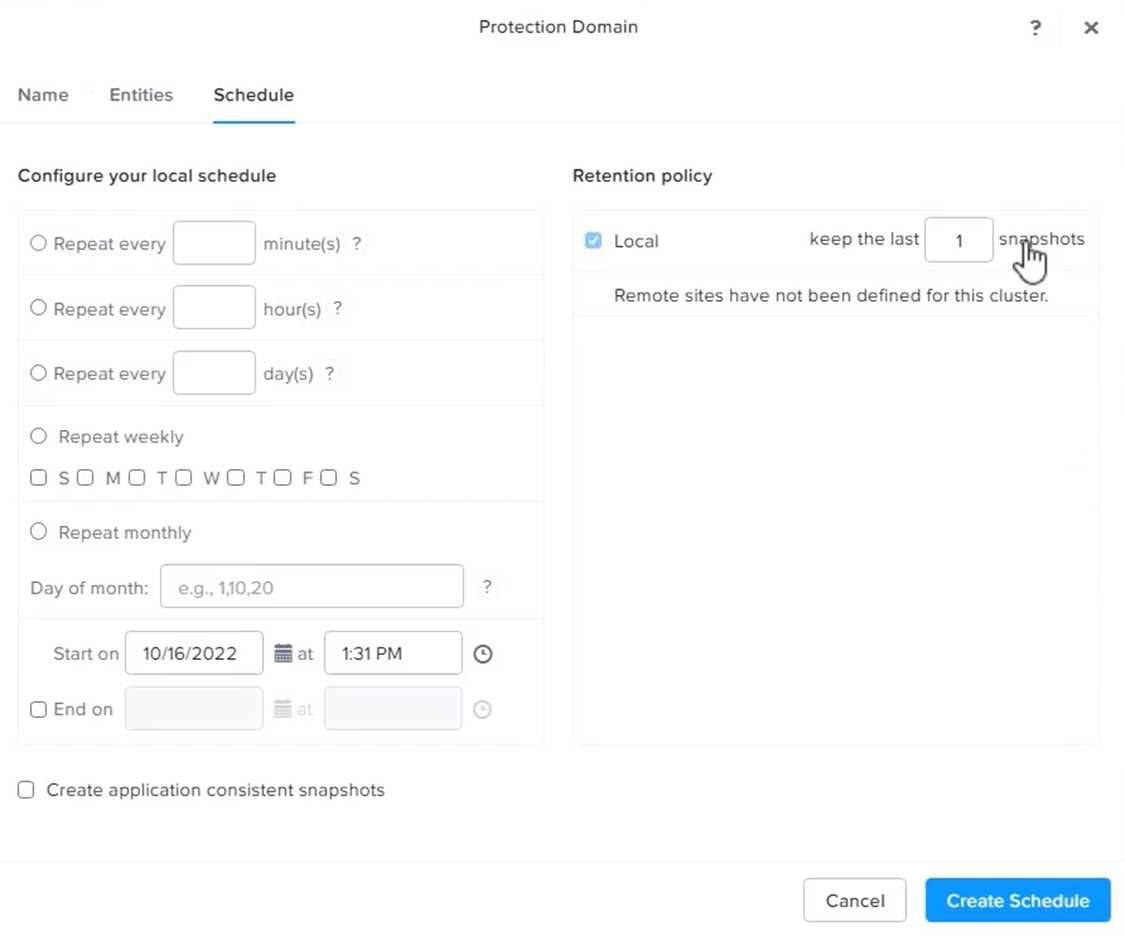
Click on Protection Domains on the left menu and click on Create Protection Domain.
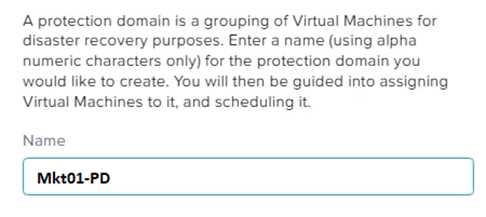
Enter a name for the protection domain, such as PD_Mkt01, and a description if required. Click Next.
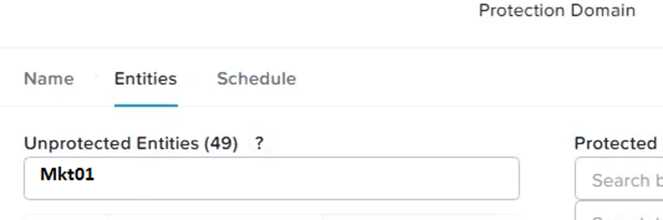
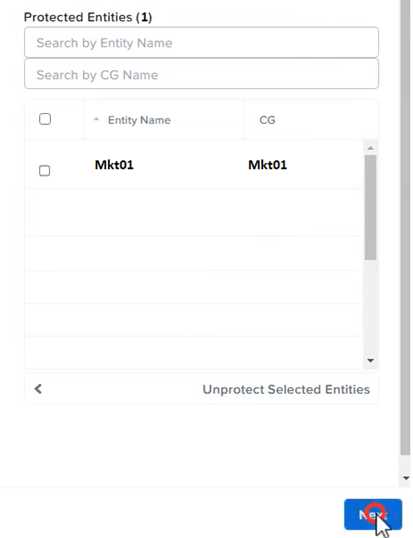
Select Mkt01 from the list of VMs and click Next.
Select Schedule Based from the drop-down menu and enter 2 hours as the interval. Click Next.
Select Remote Site from the drop-down menu and choose the remote site where you want to
replicate the VM. Click Next.
Enter 5 as the number of snapshots to retain on both local and remote sites. Click Next.
Review the protection domain details and click Finish.
Repeat the same steps for Fin01 and Dev01, using PD_Fin01 and PD_Dev01 as the protection domain
names, and adjusting the interval and retention values according to the requirements.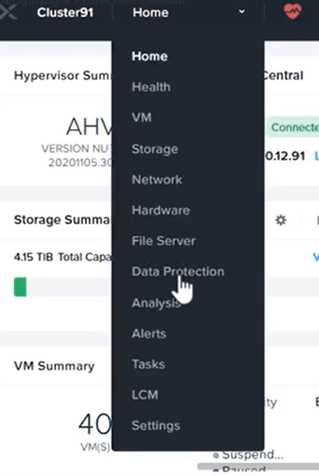


Question 15
Task 15
An administrator found a CentOS VM, Cent_Down, on the cluster with a corrupted network stack. To
correct the issue, the VM will need to be restored from a previous snapshot to become reachable on
the network again.
VM credentials:
Username: root
Password: nutanix/4u
Restore the VM and ensure it is reachable on the network by pinging 172.31.0.1 from the VM.
Power off the VM before proceeding.
Answer:
See the
Explanation for step
by step solution.
Explanation:
To restore the VM and ensure it is reachable on the network, you can follow these steps:
Log in to the Web Console of the cluster where the VM is running.
Click on Virtual Machines on the left menu and find Cent_Down from the list. Click on the power icon
to power off the VM.
Click on the snapshot icon next to the power icon to open the Snapshot Management window.
Select a snapshot from the list that was taken before the network stack was corrupted. You can use
the date and time information to choose a suitable snapshot.
Click on Restore VM and confirm the action in the dialog box. Wait for the restore process to
complete.
Click on the power icon again to power on the VM.
Log in to the VM using SSH or console with the username and password provided.
Run the commandping 172.31.0.1to verify that the VM is reachable on the network. You should see
a reply from the destination IP address.
Go to VMS from the prism central gui
Select the VMand go to More -> Guest Shutdown
Go to Snapshots tab and revert to latest snapshot available
power on vm and verify if ping is working