microsoft dp-900 practice test
microsoft azure data fundamentals
Question 1
HOTSPOT To complete the sentence, select the appropriate option in the answer area.
Hot Area: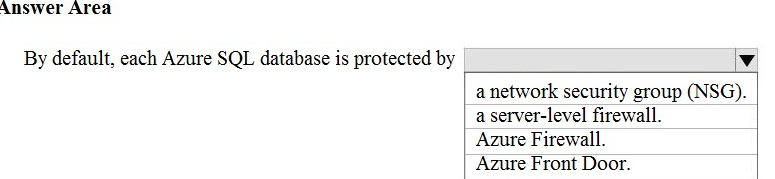
Answer:

When you create a new server in Azure SQL Database or Azure Synapse Analytics named mysqlserver, for example, a server-level firewall blocks all access to the public endpoint for the server
Reference:
https://docs.microsoft.com/en-us/azure/security/fundamentals/infrastructure-sql
Question 2
HOTSPOT
Select the answer that correctly completes the sentence.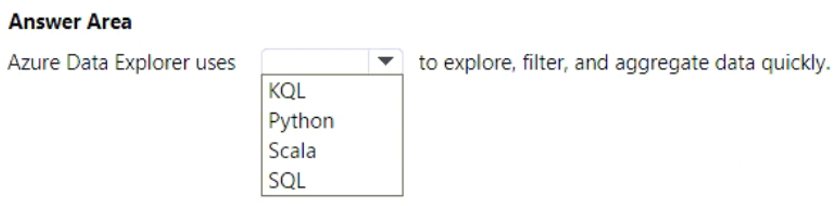
Answer:

Question 3
HOTSPOT For each of the following statements, select Yes if the statement is true. Otherwise, select No.
NOTE: Each correct selection is worth one point.
Hot Area: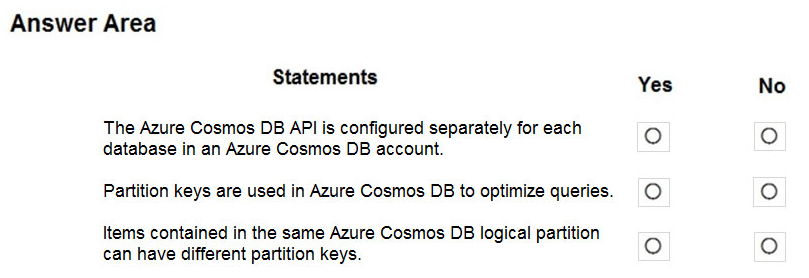
Answer:

Box 1: No -
The API determines the type of account to create. Azure Cosmos DB provides five APIs: Core (SQL) and MongoDB for document data, Gremlin for graph data,
Azure Table, and Cassandra. Currently, you must create a separate account for each API.
Box 2: Yes -
Azure Cosmos DB uses partitioning to scale individual containers in a database to meet the performance needs of your application. In partitioning, the items in a container are divided into distinct subsets called logical partitions. Logical partitions are formed based on the value of a partition key that is associated with each item in a container.
Box 3: No -
Logical partitions are formed based on the value of a partition key that is associated with each item in a container.
Reference:
https://docs.microsoft.com/en-us/azure/cosmos-db/partitioning-overview
Question 4
Your company is designing a database that will contain session data for a website. The data will include notifications, personalization attributes, and products that are added to a shopping cart.
Which type of data store will provide the lowest latency to retrieve the data?
- A. key/value
- B. graph
- C. columnar
- D. document
Answer:
c
Reference:
https://docs.microsoft.com/en-us/azure/architecture/data-guide/technology-choices/analytical-data-stores
Question 5
HOTSPOT For each of the following statements, select Yes if the statement is true. Otherwise, select No.
NOTE: Each correct selection is worth one point.
Hot Area: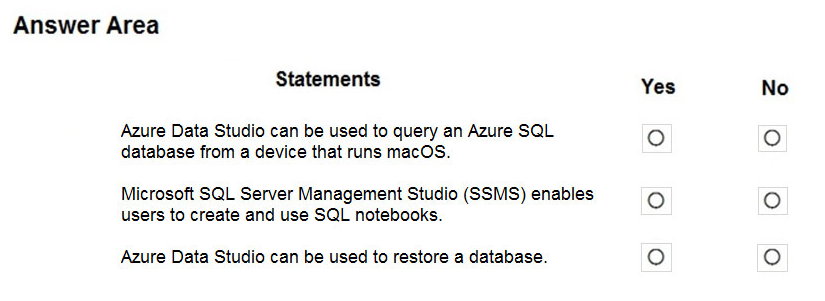
Answer:

Box 1: Yes -
Azure Data Studio is a cross-platform database tool for data professionals using on-premises and cloud data platforms on Windows, macOS, and Linux.
You can use Azure Data Studio to connect to an Azure SQL Database server. You'll then run Transact-SQL (T-SQL) statements to create and query Azure SQL databases.
Box 2: No -
SQL Server Management Studio is for configuring, managing, and administering all components within Microsoft SQL Server, not to create SQL notebooks.
Instead use Azure Data Studio to create SQL notebook.
Box 3: Yes -
You can use the Azure Data Studio to restore databases.
Reference:
https://docs.microsoft.com/en-us/sql/azure-data-studio/what-is-azure-data-studio
Question 6
A team of developers has computers that run Windows 10 and Ubuntu Desktop.
The developers need to connect to and query an Azure SQL database from each of their computers. The developers require code assistance features such as
IntelliSense.
What should the developers use?
- A. sqlcmd
- B. Microsoft SQL Server Management Studio (SSMS)
- C. Azure Data Studio
- D. Azure Data Explorer
Answer:
c
Azure Data Studio is a cross-platform database tool for data professionals who use on-premises and cloud data platforms on Windows, macOS, and Linux.
Azure Data Studio offers a modern editor experience with IntelliSense, code snippets, source control integration, and an integrated terminal.
Reference:
https://docs.microsoft.com/en-us/sql/azure-data-studio/download-azure-data-studio
Question 7
DRAG DROP Your company plans to load data from a customer relationship management (CRM) system to a data warehouse by using an extract, load, and transform (ELT) process.
Where does data processing occur for each stage of the ELT process? To answer, drag the appropriate locations to the correct stages. Each location may be used once, more than once, or not at all. You may need to drag the split bar between panes or scroll to view content.
NOTE: Each correct selection is worth one point.
Select and Place: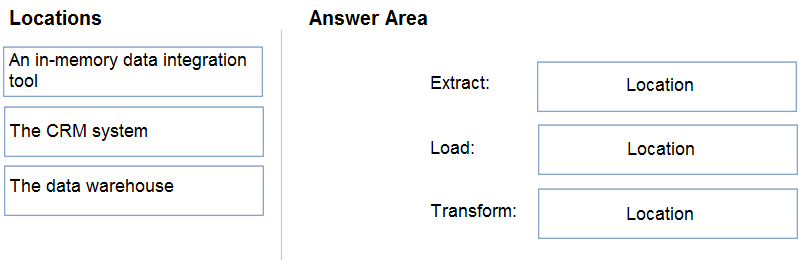
Answer:

Box 1: The CRM system -
Data is extracted from the CRM system.
Box 2: The data warehouse -
Data is loaded to the data warehouse.
Box 3: An in-memory data integration tool
The data transformation that takes place usually involves various operations, such as filtering, sorting, aggregating, joining data, cleaning data, deduplicating, and validating data.
Reference:
https://docs.microsoft.com/en-us/azure/architecture/data-guide/relational-data/etl
Question 8
Which Azure Data Factory component provides the compute environment for activities?
- A. SSIS packages
- B. an integration runtime
- C. a control flow
- D. a pipeline
Answer:
b
The Integration Runtime (IR) is the compute infrastructure used by Azure Data Factory to provide the following data integration capabilities across different network environments:
Data Flow
Data movement
Activity dispatch
SSIS package execution
Reference:
https://docs.microsoft.com/en-us/azure/data-factory/concepts-integration-runtime
Question 9
At which two levels can you set the throughput for an Azure Cosmos DB account? Each correct answer presents a complete solution.
NOTE: Each correct selection is worth one point.
- A. database
- B. item
- C. container
- D. partition
Answer:
ac
Reference:
https://docs.microsoft.com/en-us/azure/cosmos-db/set-throughput
Question 10
You have data saved in the following format.
Which format was used?
- A. YAML
- B. CSV
- C. JSON
- D. HTML
Answer:
a
azure firewall
a network security group (NSG)