microsoft da-100 practice test
Analyzing Data with Microsoft Power BI
Note: Test Case questions are at the end of the exam
Question 1 Topic 1, Case Study 1Case Study Question View Case
You need to create a calculated column to display the month based on the reporting requirements.
Which DAX expression should you use?
- A. FORMAT('Date'[date], "MMM YYYY")
- B. FORMAT('Date' [date], "M YY")
- C. FORMAT('Date'[date_id], "MMM") & "" & FORMAT('Date'[year], "#")
- D. FORMAT('Date' [date_id], "MMM YYYY")
Answer:
A
Explanation:
Scenario: In the Date table, the date_id column has a format of yyyymmdd. Users must be able to see the month in reports
as shown in the following example: Feb 2020.
Incorrect Answers:
B: The output format should be "MMM YYYY" not "M YY" C, D: The data_id is an integer and not a Date datatype.
Reference:
https://docs.microsoft.com/en-us/dax/format-function-dax https://dax.guide/format/
Question 2 Topic 1, Case Study 1Case Study Question View Case
You need to review the data for which there are concerns before creating the data model.
What should you do in Power Query Editor?
- A. Transform the sales_amount column to replace negative values with 0.
- B. Select Column distribution.
- C. Select the sales_amount column and apply a number filter.
- D. Select Column profile, and then select the sales_amount column.
Answer:
D
Explanation:
Scenario: Data Concerns
You are concerned with the quality and completeness of the sales data. You plan to verify the sales data for negative sales
amounts.
The Column profile feature provides a more in-depth look at the data in a column. It contains a column statistics chart that
displays Count, Error, Empty, Distinct, Unique, Empty String, Min, & Max of the selected column.
Reference:
https://docs.microsoft.com/en-us/power-query/data-profiling-tools
https://powerbidocs.com/2021/03/02/column-quality-column-distribution-column-profile/
Question 3 Topic 2, Case Study 2Case Study Question View Case
You need to provide a solution to provide the sales managers with the required access.
What should you include in the solution?
- A. Create a security role that has a table filter on the Sales_Manager table where username = UserName().
- B. Create a security role that has a table filter on the Region_Manager table where sales_manager_id = UserPrincipalName().
- C. Create a security role that has a table filter on the Sales_Manager table where name = UserName().
- D. Create a security role that has a table filter on the Sales_Manager table where username = sales_manager_id.
Answer:
A
Explanation:
Scenario: The region_id column can be managed by only one sales manager.
You can use Username() or userprincipalname() in DAX with Row-Level Security.
Within Power BI Desktop, username() will return a user in the format of DOMAIN\User and userprincipalname() will return a
user in the format of [email protected].
Incorrect Answers:
B: sales_manager_id is an integer and cannot be converted to a string datatype.
Reference: https://docs.microsoft.com/en-us/power-bi/admin/service-admin-rls https://powerbi.microsoft.com/en-
us/blog/using-username-in-dax-with-row-level-security/
Question 4 Topic 2, Case Study 2Case Study Question View Case
You need to create a relationship between the Weekly_Returns table and the Date table to meet the reporting requirements
of the regional managers.
What should you do?
- A. Add the Weekly_Returns data to the Sales table by using RELATED DAX functions.
- B. In the Weekly_Returns table, create a new calculated column named date_id in a format of yyyymmdd and use the calculated column to create a relationship to the Date table.
- C. Create a new table based on the Date table where date_id is unique, and then create a many-to-many relationship to Weekly_Return.
Answer:
B
Explanation:
Scenario: Regional managers require a visual to analyze weekly sales and returns.
To relate the two tables we need a common column.
Question 5 Topic 2, Case Study 2Case Study Question View Case
You need to create relationships to meet the reporting requirements of the customer service department.
What should you create?
- A. an additional date table named ShipDate, a one-to-many relationship from Date[date_id] to Sales[Sales_date_id], and a one-to-many relationship from ShipDate[date_id] to Sales [sales_ship_date_id]
- B. an additional date table named ShipDate, a many-to-many relationship from Sales[sales_date_id] to Date[date_id], and a many-to-many relationship from Sales[sales_ship_date_id] to ShipDate[date_id]
- C. a one-to-many relationship from Date[date_id] to Sales[sales_date_id] and another one-to-many relationship from Date[date_id] to Weekly_Returns[week_id]
- D. a one-to-many relationship from Sales[sales_date_id] to Date[date_id] and a one-to-many relationship from Sales[sales_ship_date_id] to Date[date_id]
Answer:
A
Explanation:
Scenario: The customer service department requires a visual that can be filtered by both sales month and ship month
independently.
In Power BI Desktop, only one relationship can be active between a Fact table and Dimension table, so we need an extra
table.
Use one-to-many relationship to be able to filter.
Incorrect Answers:
C: Cannot make a relation between a date_id and a week_id.
D: The one-to-many relationships between the Sales and the Date tables goes in the other direction: for each date there can
be many sales or shipments.
Reference: https://docs.microsoft.com/en-us/power-bi/transform-model/desktop-relationships-understand
Question 6 Topic 3, Case Study 3Case Study Question View Case
Which DAX expression should you use to get the ending balances in the balance sheet reports?
- A. CALCULATE ( SUM( BalanceSheet [BalanceAmount] ), DATESQTD( 'Date'[Date] ) )
- B. CALCULATE ( SUM( BalanceSheet [BalanceAmount] ), LASTDATE( 'Date'[Date] ) )
- C. FIRSTNONBLANK ( 'Date' [Date] SUM( BalanceSheet[BalanceAmount] ) )
- D. CALCULATE ( MAX( BalanceSheet[BalanceAmount] ), LASTDATE( 'Date' [Date] ) )
Answer:
B
Explanation:
Scenario: At least one of the balance sheet reports in the quarterly reporting package must show the ending balances for the
quarter, as well as for the previous quarter.
Semi-additive calculations, such as balance at end of month, use LASTDATE Functions.
Reference: https://docs.microsoft.com/en-us/learn/modules/create-measures-dax-power-bi/5-semi-additive-measures
Question 7 Topic 3, Case Study 3Case Study Question View Case
HOTSPOT
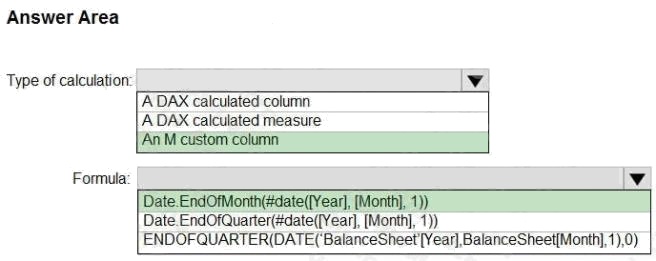
You need to calculate the last day of the month in the balance sheet data to ensure that you can relate the balance sheet
data to the Date table.
Which type of calculation and which formula should you use? To answer, select the appropriate options in the answer area.
NOTE: Each correct selection is worth one point.
Hot Area: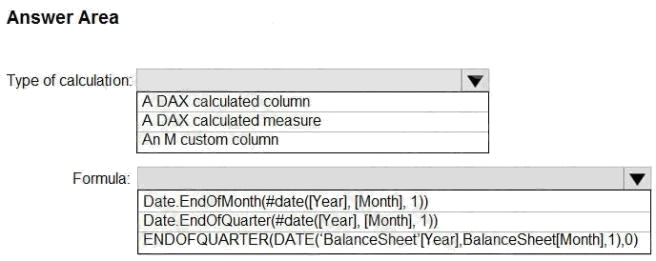
Answer:
Explanation:
Box 1: An M custom column Box 2: Date.EndOfMonth(#date([Year],[Month],1))
Reference: https://docs.microsoft.com/en-us/powerquery-m/date-endofmonth
Question 8 Topic 4, Case Study 4Case Study Question View Case
HOTSPOT
You need to create a visualization to meet the reporting requirements of the sales managers.
How should you create the visualization? To answer, select the appropriate options in the answer area.
NOTE: Each correct selection is worth one point.
Hot Area: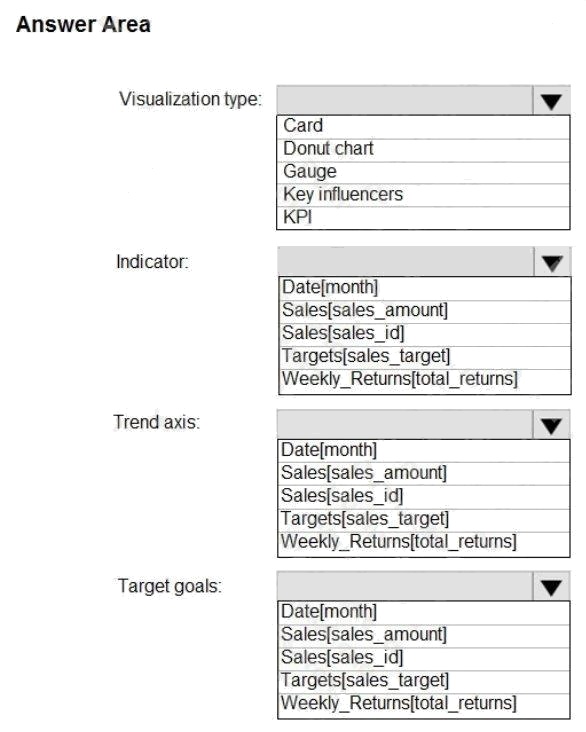
Answer:
Explanation:
Scenario: The sales managers require a visual to analyze sales performance versus sales targets.
Box 1: KPI
A Key Performance Indicator (KPI) is a visual cue that communicates the amount of progress made toward a measurable
goal.
Box 2: Sales[sales_amount]
Box 3: Date[month]
Time > FiscalMonth. This value will represent the trend.
Box 4: Targets[sales_target]
Reference: https://docs.microsoft.com/en-us/power-bi/visuals/power-bi-visualization-kpi
Question 9 Topic 4, Case Study 4Case Study Question View Case
HOTSPOT
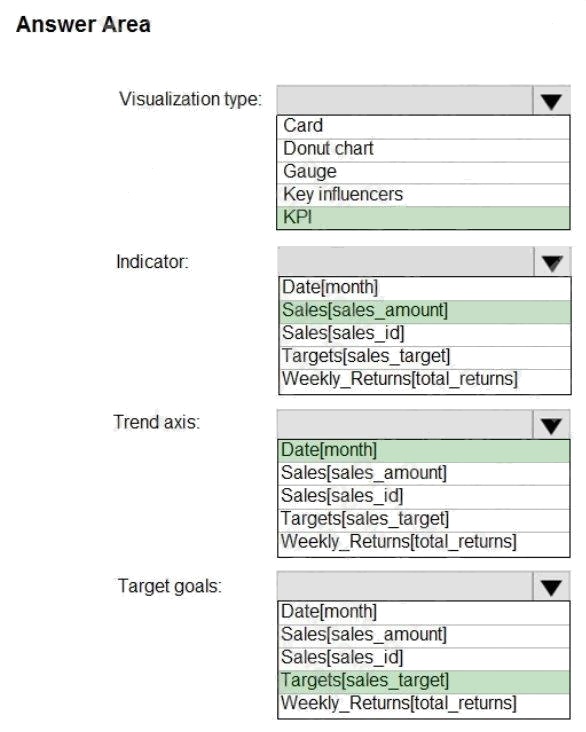
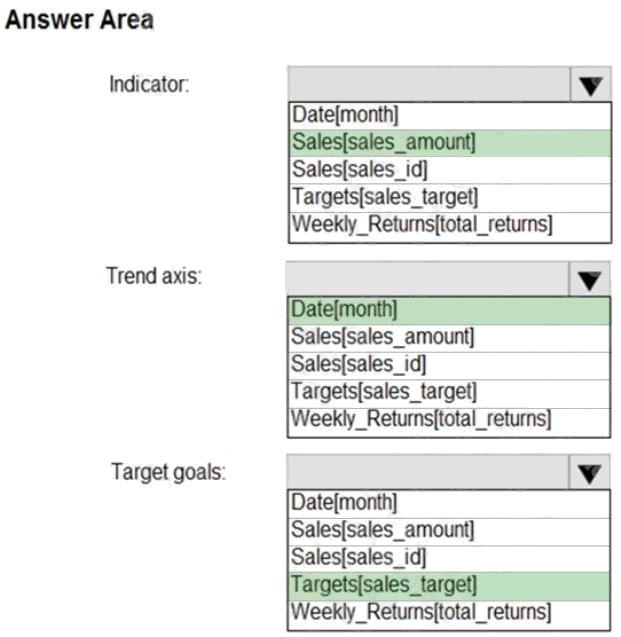
You need to create a KPI visualization to meet the reporting requirements of the sales managers.
How should you create the visualization? To answer, select the appropriate options in the answer area.
NOTE: Each correct selection is worth one point.
Hot Area: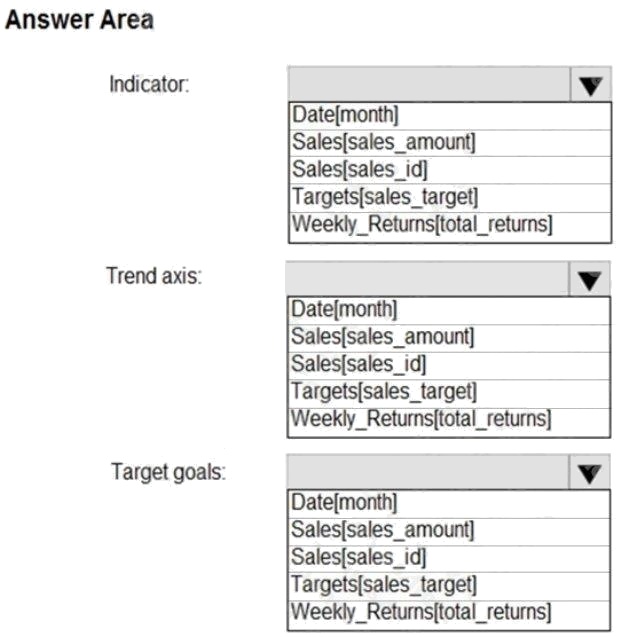
Answer:
Explanation:
Scenario: The sales managers require a visual to analyze sales performance versus sales targets.
Box 1: Sales[sales_amount]
Box 2: Date[month]
Time > FiscalMonth. This value will represent the trend.
Box 3: Targets[sales_target]
Reference:
https://docs.microsoft.com/en-us/power-bi/visuals/power-bi-visualization-kpi
Visualize the Data
Question 10 Topic 5, Case Study 5Case Study Question View Case
DRAG DROP
You need to create a DAX measure in the data model that only allows users to see projections at the appropriate level of
granularity.
How should you complete the measure? To answer, drag the appropriate values to the correct targets. Each value may be
used once, more than once, or not at all. You may need to drag the split bar between panes or scroll to view content.
NOTE: Each correct selection is worth one point.
Select and Place: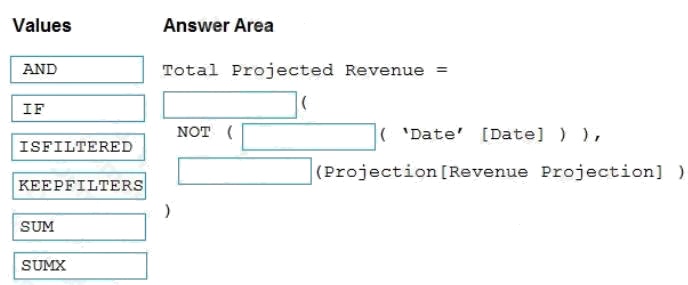
Answer:
Explanation:
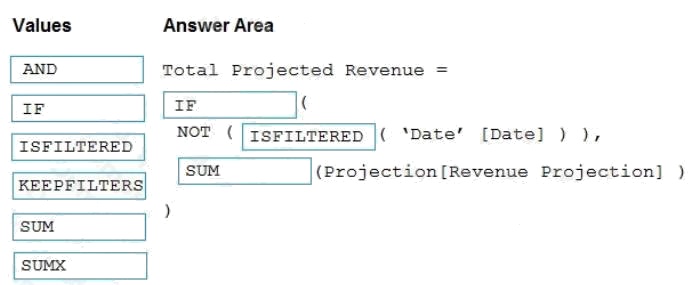
Scenario: Revenue projections are set at the monthly level and summed to show projections for the quarter.
Box 1: IF
Box 2: ISFILTERED
ISFILTERED returns TRUE when columnName is being filtered directly. If there is no filter on the column or if the filtering
happens because a different column in the same table or in a related table is being filtered then the function returns FALSE.
Box 3: SUM
Reference: https://docs.microsoft.com/en-us/dax/isfiltered-function-dax
Question 11 Topic 5, Case Study 5Case Study Question View Case
Which two types of visualizations can be used in the balance sheet reports to meet the reporting goals? Each correct answer
presents part of the solution.
NOTE: Each correct selection is worth one point.
- A. a line chart that shows balances by quarter filtered to account categories that are long-term liabilities.
- B. a clustered column chart that shows balances by date (x-axis) and account category (legend) without filters.
- C. a clustered column chart that shows balances by quarter filtered to account categories that are long-term liabilities.
- D. a pie chart that shows balances by account category without filters.
- E. a ribbon chart that shows balances by quarter and accounts in the legend.
Answer:
A C
Question 12 Topic 6, Case Study 6Case Study Question View Case
HOTSPOT
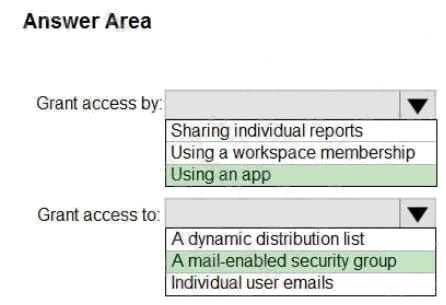
How should you distribute the reports to the board? To answer, select the appropriate options in the answer area.
NOTE: Each correct selection is worth one point.
Hot Area: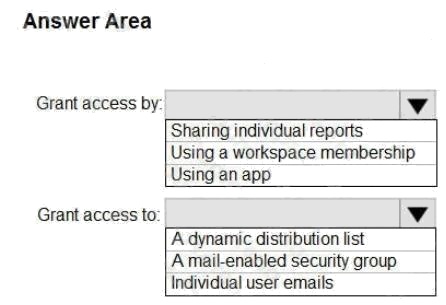
Answer:
Explanation:
Box 1: Using an app Scenario:
The company wants to provide a single package of reports to the board that contains custom navigation and links to
supplementary information.
Box 2: A mail-enabled security group Scenario: Security Requirements
The reports must be made available to the board from powerbi.com. A mail-enabled security group will be used to share
information with the board.
Reference: https://docs.microsoft.com/en-us/power-bi/admin/service-admin-rls#using-rls-with-workspaces-in-power-bi
Question 13 Topic 6, Case Study 6Case Study Question View Case
HOTSPOT
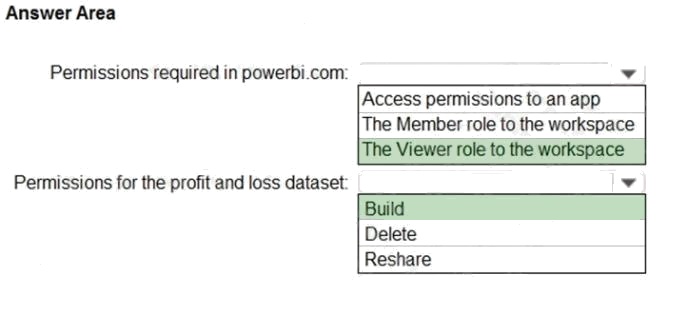
You need to grant access to the business unit analysts.
What should you configure? To answer, select the appropriate options in the answer area.
NOTE: Each correct selection is worth one point.
Hot Area: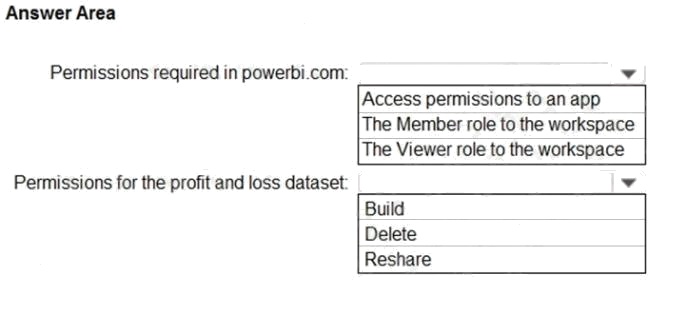
Answer:
Explanation:
Box 1: The Viewer role to the workspace
The Viewer role gives a read-only experience to its users. They can view dashboards, reports, or workbooks in the
workspace, but cant browse the datasets or dataflows. Use the Viewer role wherever you would previously use a classic
workspace set to Members can only view Power BI content.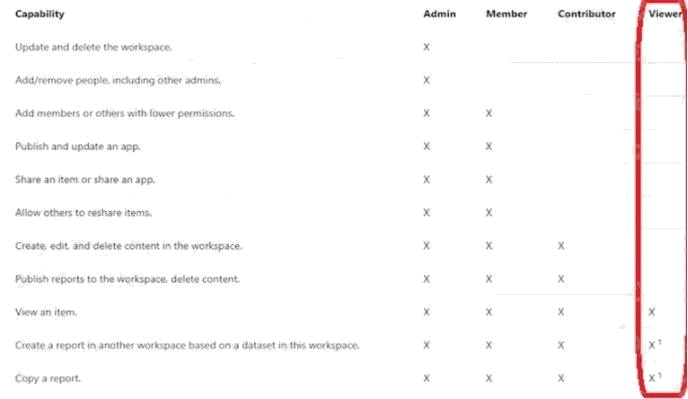
Box 2: Build
The analysts must be able to build new reports from the dataset that contains the profit and loss data.
Scenario: The reports must be made available to the board from powerbi.com.
The analysts responsible for each business unit must see all the data the board sees, except the profit and loss data, which
must be restricted to only their business unit's data. The analysts must be able to build new reports from the dataset that
contains the profit and loss data, but any reports that the analysts build must not be included in the quarterly reports for the
board. The analysts must not be able to share the quarterly reports with anyone.
Reference: https://www.nickyvv.com/2019/08/the-new-power-bi-workspace-viewer-role-explained.html
Deploy and Maintain Deliverables
Question 14 Topic 7, Mixed Questions
What is the minimum number of Power BI datasets needed to support the reports?
- A. two imported datasets
- B. a single DirectQuery dataset
- C. two DirectQuery datasets
- D. a single imported dataset
Answer:
A
Explanation:
Scenario: Data and Sources
Data for the reports comes from three sources. Detailed revenue, cost, and expense data comes from an Azure SQL
database. Summary balance sheet data comes from Microsoft Dynamics 365 Business Central. The balance sheet data is
not related to the profit and loss results, other than they both relate dates.
Monthly revenue and expense projections for the next quarter come from a Microsoft SharePoint Online list. Quarterly
projections relate to the profit and loss results by using the following shared dimensions: date, business unit, department,
and product category.
Reference: https://docs.microsoft.com/en-us/power-bi/connect-data/service-datasets-understand
Question 15 Topic 7, Mixed Questions
You have a custom connector that returns ID, From, To, Subject, Body, and Has Attachments for every email sent during the
past year. More than 10 million records are returned.
You build a report analyzing the internal networks of employees based on whom they send emails to.
You need to prevent report recipients from reading the analyzed emails. The solution must minimize the model size.
What should you do?
- A. Implement row-level security (RLS) so that the report recipients can only see results based on the emails they sent.
- B. Remove the Subject and Body columns during the import.
- C. From Model view, set the Subject and Body columns to Hidden.
Answer:
B
Explanation:
Incorrect Answers:
A, C: Does not reduce the size of the model.