general tests cphq practice test
Certified Professional in Healthcare Quality
Question 1
A nursing director for a unit in a cancer hospital Is reviewing and assessing outcomes data in the
followingscatter diagram: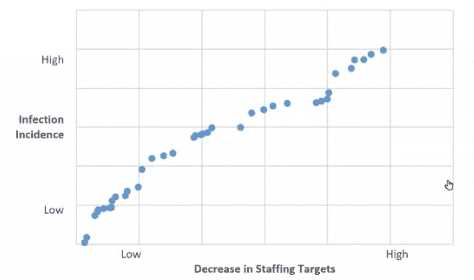
The relationship between the incidence of infection and the decrease in staffing targets is
- A. strong and positive.
- B. weak and negative.
- C. weak and positive.
- D. strong and negative.
Answer:
D
Explanation:
The scatter diagramshows that as the decrease in staffing targets becomes more significant (moving
right on the horizontal axis), the incidence of infection goes up (moving up on the vertical axis). This
indicates a negative relationship because as one variable increases, the other one decreases. The
relationship appears to be strong because the points lie closely to an imaginary line that slopes
upwards from left to right, which suggests a consistent trend across the data points.
Reference:In healthcare quality improvement, it is critical to use data to inform decision-making.
Scatter diagrams are a common tool used for this purpose. The NAHQ Healthcare Quality
Competency Framework emphasizes the importance of analyzing and utilizing data in decision-
making, as indicated in the Performance and Process Improvement domain. A strong negative
relationship in this context could indicate that decreased staffing levels are associated with higher
infection rates, which is a significant finding for a nursing director assessing outcomes and
considering quality improvement initiatives.
Question 2
A quality Improvement team has Identified specific changes to Implement for a quality Improvement
Initiative. As the next step, the team would like to establish a concrete timeline for implementation.
Which of the following is the best tool to use for this step?
- A. process map
- B. Gantt chart
- C. Ishikawa diagram
- D. bar graph
Answer:
B
Explanation:
A process map is a tool that shows the sequence of steps or activities involved in a process, and
identifies the inputs, outputs, and decision points. It can help to identify waste, variation, and
inefficiencies in a process, and to design or redesign a process for improvement. However, it does
not show the time required or allocated for each step or activity, nor the dependencies or
interrelationships among them. Therefore, it is not the best tool to use for establishing a timeline for
implementation.
A Gantt chart is a tool that shows the tasks or phases of a project, the duration and order of each task
or phase, the milestones or deliverables, and the progress or status of each task or phase. It can help
to plan and schedule a project, to monitor and communicate its progress, to identify critical tasks or
phases, and to allocate resources and responsibilities. Therefore, it is the best tool to use for
establishing a timeline for implementation.
An Ishikawa diagram (also known as a fishbone diagram or a cause-and-effect diagram) is a tool that
shows the possible causes of a problem or an effect, and organizes them into categories or branches.
It can help to identify the root causes of a problem, to brainstorm potential solutions, and to
prioritize areas for improvement. However, it does not show the time or sequence of the causes or
solutions, nor the tasks or phases of a project. Therefore, it is not the best tool to use for establishing
a timeline for implementation.
A bar graph (also known as a histogram or a column chart) is a tool that shows the frequency or
distribution of data in different categories or groups, using vertical or horizontal bars. It can help to
compare data across categories or groups, to identify patterns or trends, and to display numerical
information visually. However, it does not show the time or sequence of the data, nor the tasks or
phases of a project. Therefore, it is not the best tool to use for establishing a timeline for
implementation. Reference:
Gantt Chart | Digital Healthcare Research
Gantt Chart | Turas | Learn
Chart Template - Gantt Chart - Health Quality Council
Project Planning - Institute for Healthcare Quality Improvement
Best examples of timelines, Gantt charts, and roadmaps for the healthcare sector
[HQ Principles | NAHQ]
Question 3
The main purpose of conducting tracers as a part ofcontinuous readiness is to
- A. identify current gaps in processes of quality and patient safety that need correcting.
- B. prepare staff to be able to speak to the surveyors in a comfortable and easy manner.
- C. teach quality Improvement professionals how to prepare for accreditation surveys.
- D. minimize the number of recommendations for Improvement during an actual survey.
Answer:
A
Explanation:
Tracers are a method of assessing the quality and safety of care, treatment, or services by following
the experience of a patient or a process through the entire health care delivery system1.
Tracers are used by The Joint Commission and other accreditation bodies to evaluate the compliance
of health care organizations with the standards and requirements for accreditation1.
Tracers can help identify the strengths and weaknesses of an organization’s processes and practices,
as well as the risks and opportunities for improvement23.
Tracers can also help engage staff and stakeholders in continuous improvement activities and foster a
culture of quality and safety24.
Therefore, the main purpose of conducting tracers as a part of continuous readiness is to identify
current gaps in processes of quality and patient safety that need correcting, as this will help the
organization achieve better outcomes and meet the expectations of
accreditation1234. Reference: 1: Tracer Methodology Fact Sheet | The Joint Commission 2: How
tracer rounds can support effective continuous improvement in healthcare 3: Unlocking QTRACER’s
secret to ensure continuous improvement in healthcare 4: Continuous Service Readiness | Joint
Commission Resources
Question 4
The clinic has a goal to reduce the Healthcare Effectiveness Data and Information Set (HEDIS)
measure of ' the percent of diabetic patients with a HgA1c greater than 9.0% for accreditation. Who
should be Included on the quality Improvement team?
- A. clinic manager, provider champion. HEDIS chart abstractor
- B. clinic manager, quality Improvement specialist, provider champion
- C. HEDIS chart abstractor, coder, primary care provider
- D. primary care provider, quality improvement specialist, coder
Answer:
B
Explanation:
The HEDIS measure of the percent of diabetic patients with a HgA1c greater than 9.0% is an indicator
of poor glycemiccontrol and a risk factor for complications12. Reducing this measure is a quality
improvement goal that requires a multidisciplinary approach and data-driven strategies34.
A quality improvement team is a group of individuals with different roles and responsibilities who
work together to achieve a common aim56. The team should include representatives from various
areas of the clinic, such as management, clinical staff, and data analysts78.
The clinic manager is responsible for providing effective and consistent leadership, communicating
the vision and the steps for improvement, engaging the team in planning and monitoring, allocating
resources and training, and fostering a culture of open communication and continuous learning78.
The quality improvement specialist is responsible for analyzing and reviewing the clinical and
business data, suggesting and selecting the key priority areas, implementing and evaluating the
improvement interventions, and reporting the results and outcomes78.
The provider champion is responsible for modeling enthusiasm and support for quality
improvement, leading the clinical discussions and decisions, influencing and educating other
providers and staff, and ensuring adherence to evidence-based guidelines and best practices78.
The HEDIS chart abstractor, the coder, and the primary care provider are also important members of
the quality improvement process, but they are not sufficient to form a comprehensive and effective
team. The HEDIS chart abstractor and the coder are mainly involved in collecting and coding the
data, while the primary care provider is mainly involved in delivering the care. They need the
guidance and coordination of the clinic manager, the quality improvement specialist, and the
provider champion to align their efforts and achieve the desired
outcomes78. Reference: 1: Hemoglobin A1c Control for Patients with Diabetes (HBD) 2: Glycemic
Status Assessment for Patients with Diabetes 3: Quality Improvement Team Roles and
Responsibilities - PracticeAssist 4: The Roles & Responsibilities of A Quality Management
Team 5: QUALITY IMPROVEMENT TEAMS COMPOSITION 6: Comprehensive Diabetes Care -
NCQA 7: HEDIS 2022 Manual - Johns Hopkins Medicine 8: HEDIS® Hemoglobin A1c Control for
Patients with Diabetes (HBD) 9: GSD - Glycemic Status Assessment for Patients With Diabetes
Question 5
During a recent code blue situation at an organization, there was a delay in administering the
defibrillator's shock, A root cause analysis found the delay was due to the fact that defibrillator pads
available on the unit were not compatible with the unit's defibrillator Which of the following
applications of human factors engineering could have prevented this delay?
- A. forcing functions
- B. checklists
- C. resiliency efforts
- D. usability testing
Answer:
A
Explanation:
Human factors engineering is a science that uses a systems approach to consider human
psychological, social, physical, and biologic characteristics and applies the information to design
equipment, processes, and environments to optimize human performance, health, and safety1.
One of the applications of human factors engineering is forcing functions, which are design features
that prevent users from making errors or performing unsafe actions2. For example, a forcing function
can prevent a user from inserting a wrong key into a lock, or plugging a wrong device into a socket.
In the case of the defibrillator pads, a forcing function could have prevented the delay by making the
pads incompatible with the wrong defibrillator, or by alerting the user of the mismatch before
attempting to use the device. This would have ensured that only the correct pads were used with the
correct defibrillator, and avoided the potential harm to the patient.
The other options are not applications of human factors engineering, but rather methods or
strategies that can be used to improve quality and safety in health care. Checklists are tools that help
users remember and follow a series of steps or tasks3. Resiliency efforts are actions that help users
cope with and recover from adverse events or situations. Usability testing is a process that evaluates
how easy and effective a product or system is to use by the intended users. Reference: 1: Human
Factors in Healthcare | SpringerLink 2: Human Factors Engineering | PSNet 3: Checklist Use in
Healthcare: A Practical Guide to Improving Quality and Safety : Resilience in Healthcare: A Systematic
Review and Synthesis of the Literature : Usability Testing of Medical Devices
Question 6
Which of the following is used to assess points of vulnerability within a process?
- A. force field analysis
- B. histogram chart
- C. failure mode and effects analysis (FMEA)
- D. kaizen
Answer:
C
Explanation:
Failure mode and effects analysis (FMEA) is a tool for conducting asystematic, proactive analysis of a
process in which harm may occur12.
In an FMEA, a team representing all areas of the process under review convenes to predict and
record where, how, and to what extent the system might fail12.
FMEA is used to identify all possible failures in a design, a manufacturing or assembly process, or a
product or service, and to study the consequences of those failures2.
FMEA is a prospective assessment that identifies and improves steps in a process and reasonably
ensures a safe and clinically desirable outcome1.
FMEA is a common process analysis tool that can help healthcare quality professionals to prevent
errors, reduce variation, and improve patient safety1234.
FMEA is applied when a new or modified process, function, or service with an associated hazard has
not yet been implemented, or when improvement goals are planned for an existing process,
function, or service2.
FMEA procedure involves the following steps2:
Assemble a cross-functional team of people with diverse knowledge about the process, product, or
service, and customer needs.
Identify the scope and boundaries of the FMEA.
Fill in the identifying information at the top of the FMEA form.
Brainstorm potential failure modes and their causes and effects.
Assign a risk priority number (RPN) to each failure mode based on the severity, occurrence, and
detectability of the failure.
Prioritize the failure modes for action based on the RPNs.
Identify and implement corrective actions to eliminate or reduce the high-risk failure modes.
Evaluate the results and monitor the effectiveness of the actions.
Update the FMEA as needed. Reference: 1: Failure Modes and Effects Analysis - Ministry of
Health 2: What is FMEA? Failure Mode & Effects Analysis | ASQ 3: Failure Mode and Effects Analysis |
Digital Healthcare Research 4: Healthcare FMEA | Healthcare Failure Mode & Effects Analysis -
Quality-One
Question 7
A healthcare quality professional Is doing a study in the emergency room. Every other patient
admitted to the department Is Included in the sample. This sampling technique Is best described as
- A. quota.
- B. systematic.
- C. cluster.
- D. stratified.
Answer:
B
Explanation:
Systematic sampling is a probability sampling method where researchers select members of
thepopulation at a regular interval (or k) determined in advance12.
In this case, the healthcare quality professional is selecting every other patient admitted to the
emergency room, which means the interval k is 2.
This sampling technique is simpler and more straightforward than random sampling, and can cover a
wide study area13.
However, it also introduces some potential biases, such as over- or under-representation of certain
patterns, depending on the order of the population13.
Therefore, systematic sampling should only be used when the population order is random or
random-like, such as alphabetical or numerical12.
If the population order is cyclic or periodic, such as alternating between genders or age groups,
systematic sampling may result in a non-representative sample12. Reference: 1: Dimensions of
service quality in healthcare: a systematic review of literature 2: Systematic Sampling | A Step-by-
Step Guide with Examples 4: What is systematic sampling? 3: Systematic Sampling: Advantages and
Disadvantages
Question 8
After discharge, most patients with a mental health diagnosis have not been compliant with follow-
up visits. Which of the following Is the best way to Improve patient compliance?
- A. Benchmark with other facilities in the area to determine the rate of patient compliance.
- B. Include handouts in the discharge documents on the Importance of keeping follow-up appointments.
- C. Initiate a process where the discharge planners call patients prior to the follow-up visit
- D. Communicate to noncompliant patients that appointments should be kept.
Answer:
C
Explanation:
According to the National Association for Healthcare Quality (NAHQ), one of the core competencies
of healthcare quality professionals is patient safety, which includes ensuring effective transitions of
care and reducing preventable readmissions12.
One of the strategies to achieve this goal is to improve patient compliance with follow-up visits,
which can help monitor patient outcomes, prevent complications, and provide continuity of care34.
Among the four options given, the best way to improve patient compliance is to initiate a process
where the discharge planners call patients prior to the follow-up visit. This is because:
A phone call can serve as a reminder for the patient to keepthe appointment, as well as an
opportunity to address any barriers or concerns that the patient may have34.
A phone call can also help establish rapport and trust between the patient and the discharge planner,
which can increase patient satisfaction and adherence4.
A phone call can also allow the discharge planner to confirm the patient’s understanding of the
discharge instructions, medication regimen, and follow-up plan, and to provide any additional
education or support that the patient may need34.
Theother options are less effective because:
Benchmarking with other facilities in the area to determine the rate of patient compliance may
provide some insight into the current performance and best practices, but it does not directly
address the specific needs and preferences of the individual patient5.
Including handouts in the discharge documents on the importance of keeping follow-up
appointments may increase the patient’s awareness and knowledge, but it may not be sufficient to
motivate the patient to act on the information, especially if the patient has low health literacy,
cognitive impairment, or mental health issues.
Communicating to noncompliant patients that appointments should be kept may sound
authoritative and judgmental, which may alienate the patient and reduce their willingness to
cooperate. Instead, a patient-centered and empathetic approach that acknowledges the patient’s
challenges and preferences may be more effective. Reference: 1: [NAHQ Code of Ethics] 2: [NAHQ
HQ Principles] 3: The Importance of Patient Follow-Up | MagMutual 4: The Importance of Patient
Follow-Up and Service Recovery 5: [The Financial Case for Quality as a Business Strategy] :
[Utilization of Improvement Methodologies by Healthcare Quality Professionals During the COVID-19
Pandemic] : [Understanding the Evolving Landscape of Healthcare Quality] : https://nahq.org/about-
nahq/code-of-ethics/ : https://nahq.org/products/hq-principles/ : https://nahq.org/resources/the-
financial-case-for-quality-as-a-business-strategy-2/ : https://nahq.org/resources/journal-for-
healthcare-quality/utilization-of-improvement-methodologies-by-healthcare-quality-professionals-
during-the-covid-19-pandemic/ : https://nahq.org/news-media/news/understanding-the-evolving-
landscape-of-healthcare-quality/
Question 9
An outpatient medical clinic wants to test whether a relationship exists between two factors: lack of
available transportation and the number of times patients do not keep appointments. Which of the
following tools should be used?
- A. Pareto chart
- B. scatter diagram
- C. control chart
- D. histogram
Answer:
B
Explanation:
A scatter diagram is a graphic representation of the relationship between two variables12. It is used
to test a theory that the two variables are related and to assess the strength, trend, and shape of that
relationship2.
A Pareto chart is a type of bar chart that shows the frequency or impact of different causes or
problems in descending order, along with a line graph that shows the cumulative percentage of the
total3. It is used to identify the most significant factors among a large number of potential causes or
problems3.
A control chart is a type of line chart that shows how a process changes over time, with upper and
lower limits that indicate the range of acceptable variation4. It is used to monitor and control a
process and to detect special causes of variation that may indicate problems or improvement
opportunities4.
A histogram is a type of bar chart that shows the frequency distribution of a singlevariable in a data
set5. It is used to summarize and display the shape and spread of the data and to identify outliers or
gaps5.
Based on these definitions, the best tool to use for the outpatient medical clinic’s purpose is a scatter
diagram, as it can show whether there is a relationship between lack of available transportation and
the number of times patients do not keep appointments, and how strong or weak that relationship
is. The other tools are not suitable for this purpose, as they do not show the relationship between
two variables. Reference: 1: Scatter Diagram | Digital Healthcare Research 2: Scatter Plot - Clinical
Excellence Commission 3: Pareto Chart | Institute for Healthcare Improvement 4: Plotting basic
control charts: tutorial notes for healthcare practitioners 5: Histogram | Institute for Healthcare
Improvement
Question 10
In a healthcare organization Implementing ongoing performance Improvement (PI), which of the
following will most likely benefit the PI goals of the organization?
- A. a system selected by middle and senior management resulting from proposals by consultants
- B. a comprehensive process developed. Implemented, and monitored by the quality management department
- C. cross-functional processes evaluated by multidisciplinary teams with the support of management
- D. discrete systems relevant to, and monitored by. individual departments
Answer:
C
Explanation:
Performance improvement (PI) in healthcare refers to the systematic process of identifying,
analyzing, and enhancing the various aspects of healthcare delivery to improve patient outcomes,
safety, and satisfaction1.
PI requires a collaborative and data-driven approach that involves multiple stakeholders, such as
clinicians, managers, patients, and quality professionals2.
According to the National Association for Healthcare Quality (NAHQ), one of the core competencies
for healthcare quality professionals is to facilitate teams and lead change initiatives that align with
the organization’s strategic goals and priorities3.
NAHQ also recommends using a variety of performance improvement methodologies, such as Lean,
Six Sigma, robust process improvement, and A3 problem-solving, to address complex and cross-
functional issues in healthcare.
Therefore, the option that most likely benefits the PI goals of the organization is C. cross-functional
processes evaluated by multidisciplinary teams with the support of management. This option reflects
the best practices of PI in healthcare, as it fosters a culture of quality, engages diverse perspectives,
and leverages data and evidence to drive improvement23 .
The other options are less likely to benefit the PI goals of the organization, as they are either too
narrow, too top-down, or too siloed. These options may limit the scope, effectiveness, and
sustainability of PI efforts, as they do not involve the relevant stakeholders, address the root causes,
or align with the strategic vision of the organization23 . Reference:
1: A Guide to Performance Improvement in Healthcare
2: 9 Effective Performance Management Strategies for Healthcare
3: Healthcare Quality Solutions: Ready Your Workforce for Quality
Utilization of Improvement Methodologies by Healthcare Quality Professionals During the COVID-19
Pandemic
Question 11
Multi-voting Is frequently used in which of the following steps of the quality Improvement process?
- A. identifying root causes
- B. speculating on problem causes
- C. prioritizing Improvement opportunities
- D. Implementing solutions and controls
Answer:
C
Explanation:
Multi-voting is a technique that helps a group narrow down a large list of options to a smaller list of
the most important or preferred ones. It is also known as NGT voting or nominal prioritization 1.
Multi-voting is frequently used in the quality improvement process when there are many potential
problems or solutions to choose from, and the group needs to focus on the most critical or feasible
ones. It can help the group reach a consensus and avoid bias or domination by a few members 1.
According to the NAHQ Healthcare Quality Competency Framework, one of the skills required for
healthcare quality professionals is to “use multi-voting to prioritize improvement
opportunities” 2. This skill belongs to the domain of performance and process improvement, which
involves identifying, analyzing, and implementing changes to improve outcomes and efficiency 3.
The steps of multi-voting are as follows 1:
Generate a list of options or ideas using brainstorming, affinity diagram, or other methods.
Display thelist on a flip chart, whiteboard, or computer screen so that everyone can see it.
Ask each group member to select a certain number of options (usually 3 to 5) that they think are the
most important or relevant. They can use stickers, dots, or marks to indicate their choices.
Count the number of votes for each option and rank them from the highest to the lowest.
Eliminate the options that received the least votes (usually less than half of the highest vote) and
repeat the voting process with the remaining options until the desired number of options is reached
(usually 3 to 5).
Discuss the final list of options and agree on the priority order or the final selection. Reference:
2: NAHQ Healthcare Quality Competency Framework, Domain 3: Performance and Process
Improvement, Skill 3.1.4
3: NAHQ Healthcare Quality Competency Framework Overview 4
1: What is Multivoting? NGT Voting, Nominal Prioritization | ASQ 1
Question 12
An organization Is tracking Infection rates to determine the benchmarks for the next fiscal year. The
team Is analyzing the data for Infection rates. Which key variables are missing to interpret the graph?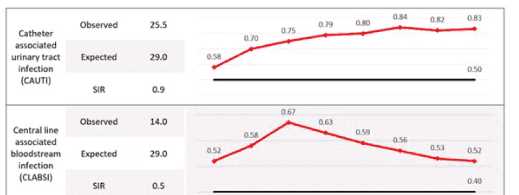
- A. the standardized infection ratio for the previous year and denominator for each measure
- B. the timeframe for each data point andthe source (or the target line
- C. the mode of the data points and expected rate for external hospitals
- D. the quality of patients and hospital compliance with handwashing
Answer:
B
Explanation:
The question pertains to key variables missing in a graph that tracks infection rates for benchmarking
purposes. The options provided suggest various combinations of data that could potentially be
missing, impacting the interpretation of the graph.
Option A suggests a need for historical data and specific denominators, but it doesn’t address
immediate contextual needs like timeframe or source/target lines.
Option C introduces external hospital expected rates and modes of data points, which might not be
directly relevant to interpreting a specific organization’s infection rate trends.
Option D focuses on qualitative aspects like patient quality and compliance with handwashing
protocols, which are essential but not directly related to interpreting graphical data.
Option B is verified as correct because it highlights two critical elements: “the timeframe for each
data point” and “the source (or target line).” These elements are fundamental to understanding any
graph as they provide context regarding when the data was collected and what benchmarks or
standards are being compared against.
The timeframe is essential to identify trends over time, seasonal variations, or impacts of specific
interventions or changes in practice.
The source or target line provides a benchmark indicating expected performance levels or goals that
the organization aims to achieve.
Without these two pieces of information, it would be challenging to derive meaningful insights from
the graph about infection rate trends and their implications for future benchmarks.
Reference:
HQ Solutions: Resource for the Healthcare Quality Professional, Fifth Edition, Chapter 5: Quality
Review and Accountability, p. 133-134
Learning Lab: Survey Readiness – A Team Approach to Success, Slide 8: Data Display
Learning Lab: The Role of the Healthcare Quality Professional in Population Health Management,
Slide 10: Data Visualization
Question 13
In order to make effective long-term changes, performance Improvement emphasizes the need to
study and understand
- A. outcomes.
- B. statistics.
- C. standards.
- D. processes.
Answer:
D
Explanation:
Performance improvement (PI) is the continuous study and improvement of processes with the
intent to better services or outcomes, and prevent or decrease the likelihood of problems, by
identifying areas of opportunity and testing new approaches to fix underlying causes of
persistent/systemic problems or barriers to improvement1.
PI is based on the assumption that most problems are related to the processes rather than the
people who perform them2. Therefore, studying and understanding the processes that deliver the
services or outcomes is essential to identify the root causes of problems, the gaps between current
and desired performance, and the potential solutions to improve them34.
PI uses various methods and tools to analyze and measure processes, such as flowcharts, process
maps, cause-and-effect diagrams, Pareto charts, histograms, control charts, run charts, and scatter
diagrams5. These tools help to visualize the steps, inputs, outputs, and variations of a process, and to
monitor and evaluate its performance over time6.
PI also uses various models and frameworks to guide and accelerate improvement work, such as the
Model for Improvement, Plan-Do-Study-Act (PDSA) cycles, Lean, Six Sigma, and Total
QualityManagement (TQM)7. These models and frameworks help to define the aim, the measures,
and the changes for improvement, and to test and implement them in a systematic and iterative
way8.
Therefore, in order to make effective long-term changes, PI emphasizes the need to study and
understand the processes that produce the services or outcomes, as this will help to identify and
address the sources of variation, waste, and inefficiency, and to achieve better quality, safety, equity,
value, and system sustainability9 . Reference: 1: QAPI Description and Background | CMS 2: Basics of
Quality Improvement | AAFP 3: How to Improve: Model for Improvement | Institute for Healthcare
Improvement 4: Performance Management and Quality Improvement - CDC 5: [Tools for Quality
Improvement | NAHQ] 6: [Quality Improvement Tools and Methods | Agency for Healthcare
Research and Quality] 7: [Quality Improvement Models and Frameworks | NAHQ] 8: [Quality
Improvement Essentials Toolkit | Institute for Healthcare Improvement] 9: [Healthcare Quality and
Safety Workforce Report: New Imperatives for Quality and Safety Mean New Imperatives for
Workforce Development | NAHQ] : [The Financial Case for Quality as a Business Strategy | NAHQ] :
[Tools for Quality Improvement | NAHQ] : [Quality Improvement Tools and Methods | Agency for
Healthcare Research and Quality] : [Quality Improvement Models and Frameworks | NAHQ] :
[Quality Improvement Essentials Toolkit | Institute for Healthcare Improvement] : [Healthcare
Quality and Safety Workforce Report: New Imperatives for Quality and Safety Mean New Imperatives
for Workforce Development | NAHQ] : [The Financial Case for Quality as a Business Strategy | NAHQ]
: Tools for Quality Improvement | NAHQ : Quality Improvement Tools and Methods | Agency for
Healthcare Research and Quality
Question 14
A patient safety manager provided training on hand hygiene guidelines. The clinical manager Is
confident that staff are following the guidelines. Which of the following Is the best method to
evaluate the current compliance with the guidelines?
- A. collection of bacterial hand cultures
- B. direct observation of staff
- C. calculation of Infection rates compared to a baseline
- D. a test with a passing score of 98%
Answer:
B
Explanation:
According to the WHO Guidelines on Hand Hygiene in Health Care, direct observation of hand
hygiene practices is the gold standard for measuring compliance1. Direct observation allows for the
assessment of the five moments of hand hygiene, the use of appropriate technique, and the
identification of barriers and facilitators to adherence1.
Direct observation also provides an opportunity for immediate feedback and education to the health
care workers, which can improve their knowledge and motivation to perform hand hygiene2. Direct
observation can be done covertly or overtly, depending on the purpose and context of the audit2.
Other methods of measuring hand hygiene compliance, such as collection of bacterial hand cultures,
calculation of infection rates, or a test with a passing score, have limitations and disadvantages. For
example, bacterial hand cultures may not reflect the actual transmission of pathogens, infection
rates may be influenced by many factors other than hand hygiene, and a test score may not correlate
with actual behavior2. Reference: 1: WHO Guidelines on Hand Hygiene in Health Care, WHO, 2009 2:
Hand Hygiene:Education, Monitoring and Feedback, CDC, 2019
Question 15
A long-term care facility Is Interested in analyzing data to determine If there Is arelationship between
the number of medications residents are prescribed and the number of falls the residents
experience. Which of the following quality tools Is most appropriate to help the long-term care
facility understand the data?
- A. Pareto chart
- B. fishbone diagram
- C. histogram
- D. chatter diagram
Answer:
D
Explanation:
A scatter diagram is a graphical tool that displays the relationship between two variables by plotting
pairs of data points on a coordinate plane. It can help identify possible correlations, trends, outliers,
and patterns in the data.
A Pareto chart is a type of bar chart that shows the frequency or impact of different factors or causes
in descending order, along with a cumulative line that indicates the percentage of the total. It can
help prioritize the most significant issues or opportunities for improvement.
A fishbone diagram is a visual tool that helps identify the root causes of a problem or effect by
organizing possible factors into categories, such as people, process, environment, etc. It can help
facilitate brainstorming and root cause analysis.
A histogram is a type of bar chart that shows the distribution of a continuous variable by grouping
the data into bins of equal width and displaying the frequency or count of each bin. It can help
describe the shape, center, spread, and outliers of the data.
In this case, the long-term care facility wants to analyze the relationship between two variables: the
number of medications and the number of falls. Therefore, a scatter diagram is the most appropriate
tool to help them understand the data. A scatter diagram can show if there is a positive, negative, or
no correlation between the two variables, and how strong or weak the correlation is. It can also
reveal any outliers or clusters of data points that may indicate other factors affecting the relationship.
A Pareto chart, a fishbone diagram, and a histogram are not suitable tools for this purpose, as they
do not show the relationship between two variables. A Pareto chart can show the relative
importance of different factors or causes, but not how they are related to each other. A fishbone
diagram can help identify the possible causes of a problem or effect, but not how they are
quantitatively related to each other. A histogram can show the distribution of a single variable, but
not how it is influenced by another variable.
Reference:
NAHQ Learning Lab: The Role of the Healthcare Quality Professional in Population Health
Management, Module 3: Data Collection and Analysis, Slide 17: Scatter Diagram
NAHQ HQ Principles, Module 2: Data Management, Lesson 2.3: Data Analysis Tools, Topic 2.3.4:
Scatter Diagram
NAHQ Journal for Healthcare Quality, Volume 42, Issue 5, September/October 2020, Article:
Utilization of Improvement Methodologies by Healthcare Quality Professionals During the COVID-19
Pandemic, Page 284: Figure 2. Scatterplot of COVID-19 Cases and Deaths by State as of June 30, 2020