Fortinet fcp faz an 7 4 practice test
FCP - FortiAnalyzer 7.4 Analyst
Question 1
Which log will generate an event with the status Unhandled?
- A. An AV log with action=quarantine.
- B. An IPS log with action=pass.
- C. A WebFilter log will action=dropped.
- D. An AppControl log with action=blocked.
Answer:
B
Explanation:
In FortiOS 7.4.1 and FortiAnalyzer 7.4.1, the "Unhandled" status in logs typically signifies that the
FortiGate encountered a security event but did not take any specific action to block or alter it. This
usually occurs in the context of Intrusion Prevention System (IPS) logs.
IPS logs with action=pass: When the IPS engine inspects traffic and determines that it does not match
any known attack signatures or violate any configured policies, it assigns the action "pass". Since no
action is taken to block or modify this traffic, the status is logged as "Unhandled."
Let's look at why the other options are incorrect:
An AV log with action=quarantine: Antivirus (AV) logs with the action "quarantine" indicate that a file
was detected as malicious and moved to quarantine. This is a definitive action, so the status wouldn't
be "Unhandled."
A WebFilter log will action=dropped: WebFilter logs with the action "dropped" indicate that web
traffic was blocked according to the configured web filtering policies. Again, this is a specific action
taken, not an "Unhandled" event.
An AppControl log with action=blocked: Application Control logs with the action "blocked" mean that
an application was denied access based on the defined application control rules. This is also a clear
action, not "Unhandled."
Question 2
Exhibit.
Which statement about the event displayed is correct?
- A. The risk source is isolated.
- B. The security risk was blocked or dropped.
- C. The security event risk is considered open.
- D. An incident was created from this event.
Answer:
B
Explanation:
In FortiOS and FortiAnalyzer logging systems, when an event has a status of "Mitigated" in the Event
Status column, it typically indicates that the system took action to address the identified threat. In
this case, the Web Filter blocked the web request to a suspicious destination, and the event status
"Mitigated" confirms that the action was successfully implemented to neutralize or block the security
risk.
Let's review the answer options:
Option A: The risk source is isolated.
This is incorrect because "isolated" would imply that FortiGate took further steps to prevent the
source device from communicating with the network. There is no indication of isolation in this event
status.
Option B: The security risk was blocked or dropped.
This is correct. The "Mitigated" status, along with the Web Filter event type and the accompanying
description, implies that the FortiGate or FortiAnalyzer successfully blocked or dropped the
suspicious web request, which corresponds to the term "mitigated."
Option C: The security event risk is considered open.
This is incorrect because an open status would indicate that no action was taken, or the threat is still
present. The "Mitigated" status indicates that the threat has been addressed.
Option D: An incident was created from this event.
This option is not correct or evident based on the given display. Although FortiAnalyzer or FortiGate
could escalate certain events to incidents, this is not indicated here.
Reference:
The FortiOS 7.4.1 and FortiAnalyzer 7.4.1 documentation specify that "Mitigated" status in logs
means the identified threat was handled, usually by blocking or dropping the action associated with
the event, particularly with Web Filter and Security Policy logs.
Question 3
Which statement describes archive logs on FortiAnalyzer?
- A. Logs that are indexed and stored in the SQL database
- B. Logs a FortiAnalyzer administrator can access in FortiView
- C. Logs compressed and saved in files with the .gz extension
- D. Logs previously collected from devices that are offline
Answer:
C
Explanation:
In FortiAnalyzer, archive logs refer to logs that have been compressed and stored to save space. This
process involves compressing the raw log files into the .gz format, which is a common compression
format used in Fortinet systems for archived data. Archiving is essential in FortiAnalyzer to optimize
storage and manage long-term retention of logs without impacting performance.
Let’s examine each option for clarity:
Option A: Logs that are indexed and stored in the SQL database
This is incorrect. While some logs are indexed and stored in an SQL database for quick access and
searchability, these are not classified as archive logs. Archived logs are typically moved out of the
database and compressed.
Option B: Logs a FortiAnalyzer administrator can access in FortiView
This is incorrect because FortiView primarily accesses logs that are active and indexed, not archived
logs. Archived logs are stored for long-term retention but are not readily available for immediate
analysis in FortiView.
Option C: Logs compressed and saved in files with the .gz extension
This is correct. Archive logs on FortiAnalyzer are stored in compressed .gz files to reduce space usage.
This archived format is used for logs that are no longer immediately needed in the SQL database but
are retained for historical or compliance purposes.
Option D: Logs previously collected from devices that are offline
This is incorrect. Although archived logs may include data from devices that are no longer online, this
is not a defining characteristic of archive logs.
Reference: FortiAnalyzer 7.4.1 documentation and configuration guides outline that archived logs are
stored in compressed files with the .gz extension to conserve storage space, ensuring FortiAnalyzer
can handle a larger volume of logs over extended periods.
Question 4
Which statement about sending notifications with incident update is true?
- A. You can send notifications to multiple external platforms.
- B. Notifications can be sent only by email.
- C. If you use multiple fabric connectors, all connectors must have the same settings.
- D. Notifications can be sent only when an incident is updated or deleted.
Answer:
A
Explanation:
In FortiOS and FortiAnalyzer, incident notifications can be sent to multiple external platforms, not
limited to a single method such as email. Fortinet's security fabric and integration capabilities allow
notifications to be sent through various fabric connectors and third-party integrations. This flexibility
is designed to ensure that incident updates reach relevant personnel or systems using preferred
communication channels, such as email, Syslog, SNMP, or integration with SIEM platforms.
Let’s review each answer option for clarity:
Option A: You can send notifications to multiple external platforms
This is correct. Fortinet’s notification system is capable of sending updates to multiple platforms,
thanks to its support for fabric connectors and external integrations. This includes options such as
email, Syslog, SNMP, and others based on configured connectors.
Option B: Notifications can be sent only by email
This is incorrect. Although email is a common method, FortiOS and FortiAnalyzer support multiple
notification methods through various connectors, allowing notifications to be directed to different
platforms as per the organization’s setup.
Option C: If you use multiple fabric connectors, all connectors must have the same settings
This is incorrect. Each fabric connector can have its unique configuration, allowing different
connectors to be tailored for specific notification and integration requirements.
Option D: Notifications can be sent only when an incident is updated or deleted
This is incorrect. Notifications can be sent upon the creation of incidents, as well as upon updates or
deletion, depending on the configuration.
Reference: According to FortiOS and FortiAnalyzer 7.4.1 documentation, notifications for incidents
can be configured across various platforms by using multiple connectors, and they are not limited to
email alone. This capability is part of the Fortinet Security Fabric, allowing for a broad range of
integrations with external systems and platforms for effective incident response.
Question 5
Which statement about the FortiSOAR management extension is correct?
- A. It requires a FortiManager configured to manage FortiGate.
- B. It runs as a docker container on FortiAnalyzer.
- C. It requires a dedicated FortiSOAR device or VM.
- D. It does not include a limited trial by default.
Answer:
C
Explanation:
The FortiSOAR management extension is designed as an independent security orchestration,
automation, and response (SOAR) solution that integrates with other Fortinet products but requires
its own dedicated device or virtual machine (VM) environment. FortiSOAR is not natively integrated
as a container or service within FortiAnalyzer or FortiManager, and it operates separately to manage
complex security workflows and incident responses across various platforms.
Let’s examine each option to determine the correct answer:
Option A: It requires a FortiManager configured to manage FortiGate
This is incorrect. FortiSOAR operates independently of FortiManager. While FortiSOAR can receive
input or data from FortiGate (often managed by FortiManager), it does not require FortiManager to
be part of its setup.
Option B: It runs as a docker container on FortiAnalyzer
This is incorrect. FortiSOAR does not run as a container within FortiAnalyzer. It requires its own
dedicated environment, either as a physical device or a virtual machine, due to the resource
requirements and specialized functions it performs.
Option C: It requires a dedicated FortiSOAR device or VM
This is correct. FortiSOAR is deployed as a standalone device or VM, which enables it to handle the
intensive processing needed for orchestrating security operations, integrating with third-party tools,
and automating responses across an organization’s security infrastructure.
Option D: It does not include a limited trial by default
This is incorrect. FortiSOAR installations may come with trial options or demos in specific scenarios,
especially for evaluation purposes. This depends on licensing and deployment policies.
Reference: The FortiSOAR platform, as outlined in Fortinet product documentation, is a standalone
SOAR solution that requires a dedicated device or VM for deployment. It integrates with Fortinet’s
Security Fabric but operates separately from FortiAnalyzer, FortiManager, and FortiGate, focusing on
advanced incident management and security automation.
Question 6
Exhibit.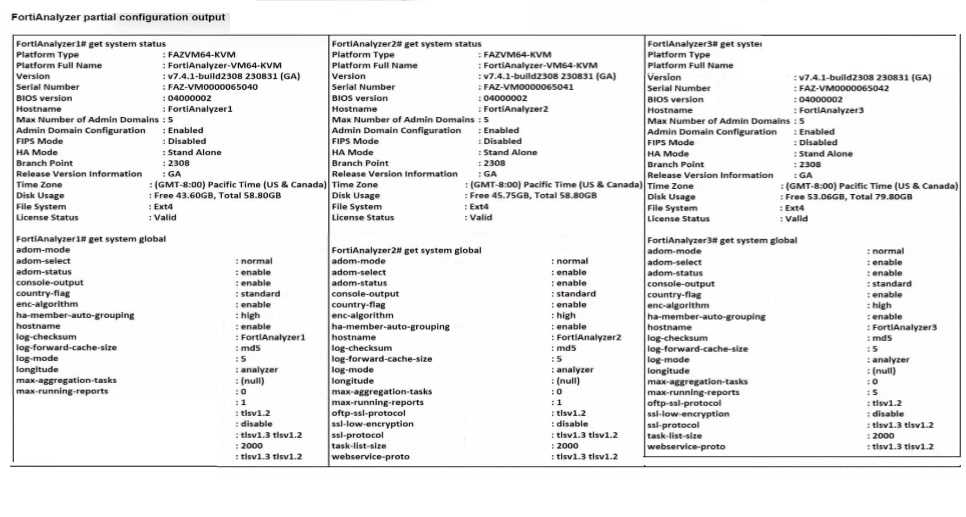
Based on the partial outputs displayed, which devices can be members of a FotiAnalyzer Fabric?
- A. FortiAnalayzer1 and FortiAnalyzer3
- B. FortiAnalyzer1 and FortiAnalyzer2
- C. FortiAnalyzer2 and FortiAnalyzer3
- D. All devices listed can be members.
Answer:
D
Explanation:
In a FortiAnalyzer Fabric, devices can participate in a cluster or grouping if they meet specific
compatibility criteria. Based on the outputs provided, let’s evaluate these criteria:
Version Compatibility:
All three devices, FortiAnalyzer1, FortiAnalyzer2, and FortiAnalyzer3, are running version v7.4.1-
build0238, which is the same across the board. This version alignment is crucial because
FortiAnalyzer Fabric requires that devices run compatible firmware versions for seamless
communication and management.
Platform Type and Configuration:
All three devices are configured as Standalone in the HA mode, which allows them to operate
independently but does not restrict their participation in a FortiAnalyzer Fabric. Each device is also
on the FAZVM64-KVM platform type, ensuring hardware compatibility.
Global Settings:
Key settings such as adm-mode, adm-status, and adom-mode are consistent across all devices (adm-
mode: normal, adm-status: enable, adom-mode: normal), which aligns with requirements for fabric
integration and role assignment flexibility.
Each device also has the log-forward-cache-size set, which is relevant for forwarding logs within a
fabric environment.
Based on the above analysis, all devices (FortiAnalyzer1, FortiAnalyzer2, and FortiAnalyzer3) meet
the requirements to be part of a FortiAnalyzer Fabric.
Reference: FortiAnalyzer 7.4.1 documentation outlines that devices within a FortiAnalyzer Fabric
should be on the same or compatible firmware versions and hardware platforms, and they must be
configured for integration. Given that all devices match the version, platform, and mode criteria,
they can all be part of the FortiAnalyzer Fabric.
Question 7
Which two actions should an administrator take to vide Compromised Hosts on FortiAnalyzer?
(Choose two.)
- A. Enable device detection on the FotiGate device that are sending logs to FortiAnalyzer.
- B. Enable web filtering in firewall policies on FortiGate devices, and make sure these logs are sent to fortiAnalyzer.
- C. Make sure all endpoints are reachable by FortiAnalyzer.
- D. Subscribe FortiAnalyzer to FortiGuard to keep its local threat database up to date.
Answer:
AB
Explanation:
To view Compromised Hosts on FortiAnalyzer, certain configurations need to be in place on both
FortiGate and FortiAnalyzer. Compromised Host data on FortiAnalyzer relies on log information from
FortiGate to analyze threats and compromised activities effectively. Here’s why the selected answers
are correct:
Option A: Enable device detection on the FortiGate devices that are sending logs to FortiAnalyzer
Enabling device detection on FortiGate allows it to recognize and log devices within the network,
sending critical information about hosts that could be compromised. This is essential because
FortiAnalyzer relies on these logs to determine which hosts may be at risk based on suspicious
activities observed by FortiGate. This setting enables FortiGate to provide device-level insights,
which FortiAnalyzer uses to populate the Compromised Hosts view.
Option B: Enable web filtering in firewall policies on FortiGate devices, and make sure these logs are
sent to FortiAnalyzer
Web filtering is crucial in identifying potentially compromised hosts since it logs any access to
malicious sites or blocked categories. FortiAnalyzer uses these web filter logs to detect suspicious or
malicious web activity, which can indicate compromised hosts. By ensuring that FortiGate sends
these web filtering logs to FortiAnalyzer, the administrator enables FortiAnalyzer to analyze and
identify hosts engaging in risky behavior.
Let’s review the other options for clarity:
Option C: Make sure all endpoints are reachable by FortiAnalyzer
This is incorrect. FortiAnalyzer does not need direct access to all endpoints. Instead, it collects data
indirectly from FortiGate logs. FortiGate devices are the ones that interact with endpoints and then
forward relevant logs to FortiAnalyzer for analysis.
Option D: Subscribe FortiAnalyzer to FortiGuard to keep its local threat database up to date
Although subscribing to FortiGuard helps keep threat intelligence updated, it is not a requirement
specifically to view compromised hosts. FortiAnalyzer primarily uses logs from FortiGate (such as
web filtering and device detection) to detect compromised hosts.
Reference: According to FortiOS and FortiAnalyzer documentation, device detection on FortiGate and
enabling web filtering logs are both recommended steps for populating the Compromised Hosts view
on FortiAnalyzer. These logs provide insights into device behaviors and web activity, which are
essential for identifying and tracking potentially compromised hosts.
Question 8
Which SQL query is in the correct order to query to database in the FortiAnalyzer?
- A. SELECT devid FROM $log GROUP BY devid WHERE ‘user’,,’ users1’
- B. SELECT FROM $log WHERE devid ‘user’,, USER1’ GROUP BY devid
- C. SELCT devid WHERE ’user’-‘ USER1’ FROM $log GROUP By devid
- D. SELECT devid FROM $log WHERE ‘user’=’ GROUP BY devid
Answer:
D
Explanation:
In FortiAnalyzer’s SQL query syntax, the typical order for querying the database follows the standard
SQL format, which is:
SELECT <column(s)> FROM <table> WHERE <condition(s)> GROUP BY <column(s)>
Option D correctly follows this structure:
SELECT devid FROM $log: This specifies that the query is selecting the devid column from the $log
table.
WHERE 'user' = ': This part of the query is intended to filter results based on a condition involving the
user column. Although there appears to be a minor typographical issue (possibly missing the user
value after =), it structurally adheres to the correct SQL order.
GROUP BY devid: This groups the results by devid, which is correctly positioned at the end of the
query.
Let’s briefly examine why the other options are incorrect:
Option A: SELECT devid FROM $log GROUP BY devid WHERE 'user', 'users1'
This is incorrect because the GROUP BY clause appears before the WHERE clause, which is out of
order in SQL syntax.
Option B: SELECT FROM $log WHERE devid 'user', USER1' GROUP BY devid
This is incorrect because it lacks a column in the SELECT statement and the WHERE clause syntax is
malformed.
Option C: SELCT devid WHERE 'user' - 'USER1' FROM $log GROUP BY devid
This is incorrect because the SELECT keyword is misspelled as SELCT, and the WHERE condition syntax
is invalid.
Reference: FortiAnalyzer documentation for SQL queries indicates that the standard SQL order should
be followed when querying logs in FortiAnalyzer. Queries should follow the format SELECT ... FROM
... WHERE ... GROUP BY ..., as demonstrated in option D.
Question 9
You created a playbook on FortiAnalyzer that uses a FortiOS connector.
When configuring the FortiGate side, which type of trigger must be used so that the actions in an
automation stich are available in the FortiOS connector?
- A. FortiAnalyzer Event Handler
- B. Fabric Connector event
- C. FortiOS Event Log
- D. Incoming webhook
Answer:
D
Explanation:
When using FortiAnalyzer to create playbooks that interact with FortiOS devices, an Incoming
Webhook trigger is required on the FortiGate side to make the actions in an automation stitch
accessible through the FortiOS connector. The incoming webhook trigger allows FortiAnalyzer to
initiate actions on FortiGate by sending HTTP POST requests to specified endpoints, which in turn
trigger automation stitches defined on the FortiGate.
Here’s an analysis of each option:
Option A: FortiAnalyzer Event Handler
This is incorrect. The FortiAnalyzer Event Handler is used within FortiAnalyzer itself for handling log
events and alerts, but it does not trigger automation stitches on FortiGate.
Option B: Fabric Connector event
This is incorrect. Fabric Connector events are related to Fortinet's Security Fabric integrations but are
not specifically used to trigger FortiGate automation stitches from FortiAnalyzer.
Option C: FortiOS Event Log
This is incorrect. While FortiOS event logs can be used for monitoring, they are not designed to
trigger automation stitches directly from FortiAnalyzer.
Option D: Incoming webhook
This is correct. The Incoming Webhook trigger on FortiGate enables it to receive requests from
FortiAnalyzer, allowing playbooks to activate automation stitches defined on the FortiGate device.
This method is commonly used to integrate actions from FortiAnalyzer to FortiGate via the FortiOS
connector.
Reference: According to FortiOS and FortiAnalyzer documentation, when integrating FortiAnalyzer
playbooks with FortiGate automation stitches, the recommended trigger type on FortiGate is an
Incoming Webhook, allowing FortiAnalyzer to interact with FortiGate’s automation framework
through the FortiOS connector.
Question 10
When managing incidents on FortiAnlyzer, what must an analyst be aware of?
- A. You can manually attach generated reports to incidents.
- B. The status of the incident is always linked to the status of the attach event.
- C. Severity incidents rated with the level High have an initial service-level agreement (SLA) response time of 1 hour.
- D. Incidents must be acknowledged before they can be analyzed.
Answer:
A
Explanation:
In FortiAnalyzer's incident management system, analysts have the option to manually manage
incidents, which includes attaching relevant reports to an incident for further investigation and
documentation. This feature allows analysts to consolidate information, such as detailed reports on
suspicious activity, into an incident record, providing a comprehensive view for incident response.
Let's review the other options to clarify why they are incorrect:
Option A: You can manually attach generated reports to incidents
This is correct. FortiAnalyzer allows analysts to manually attach reports to incidents, which is
beneficial for providing additional context, evidence, or analysis related to the incident. This
functionality is part of the incident management process and helps streamline information for
tracking and resolution.
Option B: The status of the incident is always linked to the status of the attached event
This is incorrect. The status of an incident on FortiAnalyzer is managed independently of the status of
any attached events. An incident can contain multiple events, each with different statuses, but the
incident itself is tracked separately.
Option C: Severity incidents rated with the level High have an initial service-level agreement (SLA)
response time of 1 hour
This is incorrect. While incidents have severity levels, specific SLA response times are typically set
according to the organization’s incident response policy, and FortiAnalyzer does not impose a default
SLA response time of 1 hour for high-severity incidents.
Option D: Incidents must be acknowledged before they can be analyzed
This is incorrect. Incidents on FortiAnalyzer can be analyzed even if they are not yet acknowledged.
Acknowledging an incident is often part of the workflow to mark it as being actively addressed, but it
is not a prerequisite for analysis.
Reference: According to FortiAnalyzer documentation, analysts can attach reports to incidents
manually, making option A correct. This feature enables better tracking and documentation within
the incident management system on FortiAnalyzer.
Question 11
Why must you wait for several minutes before you run a playbook that you just created?
- A. FortiAnalyzer needs that time to parse the new playbook.
- B. FortiAnalyzer needs that time to debug the new playbook.
- C. FortiAnalyzer needs that time to back up the current playbooks.
- D. FortiAnalyzer needs that time to ensure there are no other playbooks running.
Answer:
A
Explanation:
When a new playbook is created on FortiAnalyzer, the system requires some time to parse and
validate the playbook before it can be executed. Parsing involves checking the playbook's structure,
ensuring that all syntax and logic are correct, and preparing the playbook for execution within
FortiAnalyzer’s automation engine. This initial parsing step is necessary for FortiAnalyzer to load the
playbook into its operational environment correctly.
Here’s why the other options are incorrect:
Option A: FortiAnalyzer needs that time to parse the new playbook
This is correct. The delay is due to the parsing and setup process required to prepare the new
playbook for execution. FortiAnalyzer’s automation engine checks for any issues or dependencies
within the playbook, ensuring that it can run without errors.
Option B: FortiAnalyzer needs that time to debug the new playbook
This is incorrect. Debugging is not an automatic process that FortiAnalyzer undertakes after playbook
creation. Debugging, if necessary, is a manual task performed by the administrator if there are issues
with the playbook execution.
Option C: FortiAnalyzer needs that time to back up the current playbooks
This is incorrect. FortiAnalyzer does not automatically back up playbooks every time a new one is
created. Backups of configuration and playbooks are typically scheduled as part of routine
maintenance and are not triggered by playbook creation.
Option D: FortiAnalyzer needs that time to ensure there are no other playbooks running
This is incorrect. FortiAnalyzer can manage multiple playbooks running simultaneously, so it does not
require waiting for other playbooks to finish before initiating a new one. The waiting time specifically
relates to the parsing process of the newly created playbook.
Reference: FortiAnalyzer documentation states that after creating a playbook, a brief delay is
expected as the system parses and validates the playbook. This ensures that any syntax errors or
logical inconsistencies are resolved before the playbook is executed, making option A the correct
answer.
Question 12
Exhibit.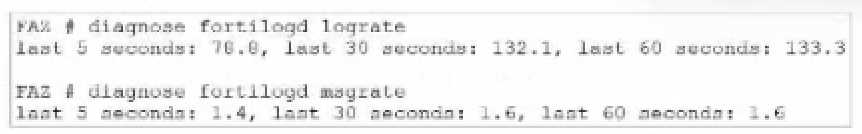
What can you conclude about the output?
- A. The message rate being lower that the log rate is normal.
- B. Both messages and logs are almost finished indexing.
- C. There are more traffic logs than event logs.
- D. The output is ADOM specific
Answer:
A
Explanation:
In this output, we see two diagnostic commands executed on a FortiAnalyzer device:
diagnose fortilogd lograte: This command shows the rate at which logs are being processed by the
FortiAnalyzer in terms of log entries per second.
diagnose fortilogd msgrate: This command displays the message rate, or the rate at which individual
messages are being processed.
The values provided in the exhibit output show:
Log rate (lograte): Consistently high, showing values such as 70.0, 132.1, and 133.3 logs per second
over different time intervals.
Message rate (msgrate): Lower values, around 1.4 to 1.6 messages per second.
Explanation
Interpretation of log rate vs. message rate: In FortiAnalyzer, the log rate typically refers to the rate of
logs being stored or indexed, while the message rate refers to individual messages within these logs.
Given that a single log entry can contain multiple messages, it's common to see a lower message
rate relative to the log rate.
Understanding normal operation: In this case, the message rate being lower than the log rate is
expected and typical behavior. This discrepancy can arise because each log entry may bundle
multiple related messages, reducing the message rate relative to the log rate.
Conclusion
Correct Answe r : A. The message rate being lower than the log rate is normal.
This aligns with the normal operational behavior of FortiAnalyzer in processing logs and messages.
There is no indication that both logs and messages are nearly finished indexing, as that would
typically show diminishing rates toward zero, which is not the case here. Additionally, there’s no
information in this output about specific ADOMs or a comparison between traffic logs and event
logs. Thus, options B, C, and D are incorrect.
Reference:
FortiOS 7.4.1 and FortiAnalyzer 7.4.1 command guides for diagnose fortilogd lograte and diagnose
fortilogd msgrate.
Question 13
Exhibit.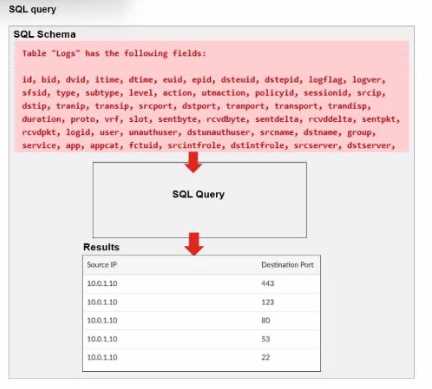
A fortiAnalyzer analyst is customizing a SQL query to use in a report.
Which SQL query should the analyst run to get the expected results?
A)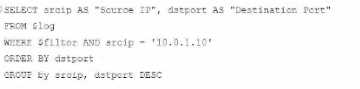
B)
C)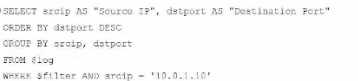
D)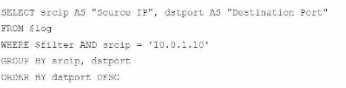
- A. Option A
- B. Option B
- C. Option C
- D. Option D
Answer:
A
Explanation:
The requirement here is to construct a SQL query that retrieves logs with specific fields, namely
"Source IP" and "Destination Port," for entries where the source IP address matches 10.0.1.10. The
correct syntax is essential for selecting, filtering, ordering, and grouping the results as shown in the
expected outcome.
Analysis of the Options:
Option A Explanation:
SELECT srcip AS "Source IP", dstport AS "Destination Port": This syntax selects srcip and dstport,
renaming them to "Source IP" and "Destination Port" respectively in the output.
FROM $log: Specifies the log table as the data source.
WHERE $filter AND srcip = '10.0.1.10': This line filters logs to only include entries with srcip equal to
10.0.1.10.
ORDER BY dstport DESC: Orders the results in descending order by dstport.
GROUP BY srcip, dstport: Groups results by srcip and dstport, which is valid SQL syntax.
This option meets all the requirements to get the expected results accurately.
Option B Explanation:
WHERE $filter AND Source IP != '10.0.1.10': Uses != instead of =. This would exclude logs from the
specified IP 10.0.1.10, which is contrary to the expected result.
Option C Explanation:
The ORDER BY clause appears before the FROM clause, which is incorrect syntax. SQL requires the
FROM clause to follow the SELECT clause directly.
Option D Explanation:
The GROUP BY clause should follow the FROM clause. However, here, it’s located after WHERE,
making it syntactically incorrect.
Conclusion:
Correct Answe r : A. Option A
This option aligns perfectly with standard SQL syntax and filters correctly for srcip = '10.0.1.10', while
ordering and grouping as required.
Reference:
FortiAnalyzer 7.4.1 SQL query capabilities and syntax for report customization.
Question 14
Exhibit.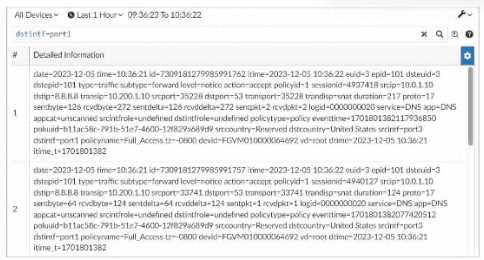
What can you conclude about these search results? (Choose two.)
- A. They can be downloaded to a file.
- B. They are sortable by columns and customizable.
- C. They are not available for analysis in FortiView.
- D. They were searched by using text mode.
Answer:
A, D
Explanation:
In this exhibit, we observe a search query on the FortiAnalyzer interface displaying log data with
details about the connection events, including fields like date, srcip, dstip, service, and dstintf. This
setup allows for several functionalities within FortiAnalyzer.
Explanation:
Option A - Download Capability:
FortiAnalyzer provides the option to download search results and reports to a file in multiple
formats, such as CSV or PDF, allowing for further offline analysis or archival. This makes it possible to
save the search results shown in the exhibit to a file.
Conclusion: Correct.
Option B - Sorting and Customization:
The FortiAnalyzer interface allows users to sort and customize columns for search results. This helps
in organizing and viewing the logs in a manner that fits the analyst's needs, such as ordering logs by
time, srcip, dstip, or other fields.
Conclusion: Correct.
Option C - Availability in FortiView:
FortiView is a tool within FortiAnalyzer that visualizes data and provides analysis capabilities,
including traffic and security event logs. Since these are traffic logs, they are typically available for
visualization and analysis within FortiView.
Conclusion: Incorrect.
Option D - Text Mode Search:
The search displayed here appears to be in a structured format, which implies it might be utilizing
filters rather than a free-text search. FortiAnalyzer allows both structured searches and text searches,
but there's no indication here that text mode was used.
Conclusion: Incorrect.
Conclusion:
Correct Answe r : A. They can be downloaded to a file. and B. They are sortable by columns and
customizable.
These options are consistent with FortiAnalyzer's capabilities for managing, exporting, and
customizing log data.
Reference:
FortiAnalyzer 7.4.1 documentation on search, export functionalities, and customizable views.
Question 15
Which two methods can you use to send notifications when an event occurs that matches a
configured event handler? (Choose two.)
- A. Send Alert through Fabric Connectors
- B. Send SNMP trap
- C. Send SMS notification
- D. Send Alert through FortiSIEM MEA
Answer:
BC
Explanation:
In FortiAnalyzer, event handlers can be configured to trigger specific notifications when an event
matches defined criteria. These notifications are designed to alert administrators in real time about
critical events.
Explanation:
Option B - Send SNMP Trap:
FortiAnalyzer supports sending SNMP traps as one of the notification methods when an event
matches an event handler. This allows integration with SNMP-enabled network management
systems, which can then trigger further alerts or actions based on the trap received.
Conclusion: Correct.
Option C - Send SMS Notification:
FortiAnalyzer also supports SMS notifications, enabling alerts to be sent via SMS to predefined
recipients. This method is useful for administrators who require immediate alerts but may not have
access to email or other notification systems at all times.
Conclusion: Correct.
Option A - Send Alert through Fabric Connectors:
While Fabric Connectors allow FortiAnalyzer to interact with other parts of the Security Fabric, they
are primarily used for data sharing and automation rather than directly for sending alerts or
notifications.
Conclusion: Incorrect.
Option D - Send Alert through FortiSIEM MEA:
FortiSIEM integration allows for data sharing and further analysis within the Fortinet ecosystem, but
it does not directly act as a notification method from FortiAnalyzer itself.
Conclusion: Incorrect.
Conclusion:
Correct Answe r : B. Send SNMP trap and C. Send SMS notification
These options represent valid notification methods for FortiAnalyzer’s event handler configuration.
Reference:
FortiAnalyzer 7.4.1 documentation on event handler configuration and available notification
methods.