databricks databricks machine learning associate practice test
Databricks Certified Machine Learning Associate Exam
Question 1
A machine learning engineer has created a Feature Table new_table using Feature Store Client fs.
When creating the table, they specified a metadata description with key information about the
Feature Table. They now want to retrieve that metadata programmatically.
Which of the following lines of code will return the metadata description?
- A. There is no way to return the metadata description programmatically.
- B. fs.create_training_set("new_table")
- C. fs.get_table("new_table").description
- D. fs.get_table("new_table").load_df()
- E. fs.get_table("new_table")
Answer:
C
Explanation:
To retrieve the metadata description of a feature table created using the Feature Store Client
(referred here as fs), the correct method involves calling get_table on the fs client with the table
name as an argument, followed by accessing the description attribute of the returned object. The
code snippet fs.get_table("new_table").description correctly achieves this by fetching the table
object for "new_table" and then accessing its description attribute, where the metadata is stored.
The other options do not correctly focus on retrieving the metadata description.
Reference:
Databricks Feature Store documentation (Accessing Feature Table Metadata).
Question 2
A data scientist has a Spark DataFrame spark_df. They want to create a new Spark DataFrame that
contains only the rows from spark_df where the value in column price is greater than 0.
Which of the following code blocks will accomplish this task?
- A. spark_df[spark_df["price"] > 0]
- B. spark_df.filter(col("price") > 0)
- C. SELECT * FROM spark_df WHERE price > 0
- D. spark_df.loc[spark_df["price"] > 0,:]
- E. spark_df.loc[:,spark_df["price"] > 0]
Answer:
B
Explanation:
To filter rows in a Spark DataFrame based on a condition, you use the filter method along with a
column condition. The correct syntax in PySpark to accomplish this task is spark_df.filter(col("price")
> 0), which filters the DataFrame to include only those rows where the value in the "price" column is
greater than 0. The col function is used to specify column-based operations. The other options
provided either do not use correct Spark DataFrame syntax or are intended for different types of data
manipulation frameworks like pandas.
Reference:
PySpark DataFrame API documentation (Filtering DataFrames).
Question 3
A health organization is developing a classification model to determine whether or not a patient
currently has a specific type of infection. The organization's leaders want to maximize the number of
positive cases identified by the model.
Which of the following classification metrics should be used to evaluate the model?
- A. RMSE
- B. Precision
- C. Area under the residual operating curve
- D. Accuracy
- E. Recall
Answer:
E
Explanation:
When the goal is to maximize the identification of positive cases in a classification task, the metric of
interest is Recall. Recall, also known as sensitivity, measures the proportion of actual positives that
are correctly identified by the model (i.e., the true positive rate). It is crucial for scenarios where
missing a positive case (false negative) has serious implications, such as in medical diagnostics. The
other metrics like Precision, RMSE, and Accuracy serve different aspects of performance
measurement and are not specifically focused on maximizing the detection of positive cases alone.
Reference:
Classification Metrics in Machine Learning (Understanding Recall).
Question 4
In which of the following situations is it preferable to impute missing feature values with their
median value over the mean value?
- A. When the features are of the categorical type
- B. When the features are of the boolean type
- C. When the features contain a lot of extreme outliers
- D. When the features contain no outliers
- E. When the features contain no missing no values
Answer:
C
Explanation:
Imputing missing values with the median is often preferred over the mean in scenarios where the
data contains a lot of extreme outliers. The median is a more robust measure of central tendency in
such cases, as it is not as heavily influenced by outliers as the mean. Using the median ensures that
the imputed values are more representative of the typical data point, thus preserving the integrity of
the dataset's distribution. The other options are not specifically relevant to the question of handling
outliers in numerical data.
Reference:
Data Imputation Techniques (Dealing with Outliers).
Question 5
A data scientist has replaced missing values in their feature set with each respective feature
variable’s median value. A colleague suggests that the data scientist is throwing away valuable
information by doing this.
Which of the following approaches can they take to include as much information as possible in the
feature set?
- A. Impute the missing values using each respective feature variable's mean value instead of the median value
- B. Refrain from imputing the missing values in favor of letting the machine learning algorithm determine how to handle them
- C. Remove all feature variables that originally contained missing values from the feature set
- D. Create a binary feature variable for each feature that contained missing values indicating whether each row's value has been imputed
- E. Create a constant feature variable for each feature that contained missing values indicating the percentage of rows from the feature that was originally missing
Answer:
D
Explanation:
By creating a binary feature variable for each feature with missing values to indicate whether a value
has been imputed, the data scientist can preserve information about the original state of the data.
This approach maintains the integrity of the dataset by marking which values are original and which
are synthetic (imputed). Here are the steps to implement this approach:
Identify Missing Values: Determine which features contain missing values.
Impute Missing Values: Continue with median imputation or choose another method (mean, mode,
regression, etc.) to fill missing values.
Create Indicator Variables: For each feature that had missing values, add a new binary feature. This
feature should be '1' if the original value was missing and imputed, and '0' otherwise.
Data Integration: Integrate these new binary features into the existing dataset. This maintains a
record of where data imputation occurred, allowing models to potentially weight these observations
differently.
Model Adjustment: Adjust machine learning models to account for these new features, which might
involve considering interactions between these binary indicators and other features.
Reference
"Feature Engineering for Machine Learning" by Alice Zheng and Amanda Casari (O'Reilly Media,
2018), especially the sections on handling missing data.
Scikit-learn documentation on imputing missing values: https://scikit-learn.org/stable/modules/impute.html
Question 6
A data scientist is wanting to explore summary statistics for Spark DataFrame spark_df. The data
scientist wants to see the count, mean, standard deviation, minimum, maximum, and interquartile
range (IQR) for each numerical feature.
Which of the following lines of code can the data scientist run to accomplish the task?
- A. spark_df.summary ()
- B. spark_df.stats()
- C. spark_df.describe().head()
- D. spark_df.printSchema()
- E. spark_df.toPandas()
Answer:
A
Explanation:
The summary() function in PySpark's DataFrame API provides descriptive statistics which include
count, mean, standard deviation, min, max, and quantiles for numeric columns. Here are the steps
on how it can be used:
Import PySpark: Ensure PySpark is installed and correctly configured in the Databricks environment.
Load Data: Load the data into a Spark DataFrame.
Apply Summary: Use spark_df.summary() to generate summary statistics.
View Results: The output from the summary() function includes the statistics specified in the query
(count, mean, standard deviation, min, max, and potentially quartiles which approximate the
interquartile range).
Reference
PySpark Documentation:
https://spark.apache.org/docs/latest/api/python/reference/api/pyspark.sql.DataFrame.summary.ht
ml
Question 7
An organization is developing a feature repository and is electing to one-hot encode all categorical
feature variables. A data scientist suggests that the categorical feature variables should not be one-
hot encoded within the feature repository.
Which of the following explanations justifies this suggestion?
- A. One-hot encoding is not supported by most machine learning libraries.
- B. One-hot encoding is dependent on the target variable's values which differ for each application.
- C. One-hot encoding is computationally intensive and should only be performed on small samples of training sets for individual machine learning problems.
- D. One-hot encoding is not a common strategy for representing categorical feature variables numerically.
- E. One-hot encoding is a potentially problematic categorical variable strategy for some machine learning algorithms.
Answer:
E
Explanation:
One-hot encoding transforms categorical variables into a format that can be provided to machine
learning algorithms to better predict the output. However, when done prematurely or universally
within a feature repository, it can be problematic:
Dimensionality Increase: One-hot encoding significantly increases the feature space, especially with
high cardinality features, which can lead to high memory consumption and slower computation.
Model Specificity: Some models handle categorical variables natively (like decision trees and
boosting algorithms), and premature one-hot encoding can lead to inefficiency and loss of
information (e.g., ordinal relationships).
Sparse Matrix Issue: It often results in a sparse matrix where most values are zero, which can be
inefficient in both storage and computation for some algorithms.
Generalization vs. Specificity: Encoding should ideally be tailored to specific models and use cases
rather than applied generally in a feature repository.
Reference
"Feature Engineering and Selection: A Practical Approach for Predictive Models" by Max Kuhn and
Kjell Johnson (CRC Press, 2019).
Question 8
A data scientist has created two linear regression models. The first model uses price as a label
variable and the second model uses log(price) as a label variable. When evaluating the RMSE of each
model by comparing the label predictions to the actual price values, the data scientist notices that
the RMSE for the second model is much larger than the RMSE of the first model.
Which of the following possible explanations for this difference is invalid?
- A. The second model is much more accurate than the first model
- B. The data scientist failed to exponentiate the predictions in the second model prior to computing the RMSE
- C. The data scientist failed to take the log of the predictions in the first model prior to computing the RMSE
- D. The first model is much more accurate than the second model
- E. The RMSE is an invalid evaluation metric for regression problems
Answer:
E
Explanation:
The Root Mean Squared Error (RMSE) is a standard and widely used metric for evaluating the
accuracy of regression models. The statement that it is invalid is incorrect. Here’s a breakdown of
why the other statements are or are not valid:
Transformations and RMSE Calculation: If the model predictions were transformed (e.g., using log),
they should be converted back to their original scale before calculating RMSE to ensure accuracy in
the evaluation. Missteps in this conversion process can lead to misleading RMSE values.
Accuracy of Models: Without additional information, we can't definitively say which model is more
accurate without considering their RMSE values properly scaled back to the original price scale.
Appropriateness of RMSE: RMSE is entirely valid for regression problems as it provides a measure of
how accurately a model predicts the outcome, expressed in the same units as the dependent
variable.
Reference
"Applied Predictive Modeling" by Max Kuhn and Kjell Johnson (Springer, 2013), particularly the
chapters discussing model evaluation metrics.
Question 9
A data scientist uses 3-fold cross-validation when optimizing model hyperparameters for a regression
problem. The following root-mean-squared-error values are calculated on each of the validation
folds:
• 10.0
• 12.0
• 17.0
Which of the following values represents the overall cross-validation root-mean-squared error?
- A. 13.0
- B. 17.0
- C. 12.0
- D. 39.0
- E. 10.0
Answer:
A
Explanation:
To calculate the overall cross-validation root-mean-squared error (RMSE), you average the RMSE
values obtained from each validation fold. Given the RMSE values of 10.0, 12.0, and 17.0 for the
three folds, the overall cross-validation RMSE is calculated as the average of these three values:
OverallCVRMSE=10.0+12.0+17.03=39.03=13.0OverallCVRMSE=310.0+12.0+17.0=339.0=13.0
Thus, the correct answer is 13.0, which accurately represents the average RMSE across all folds.
Reference:
Cross-validation in Regression (Understanding Cross-Validation Metrics).
Question 10
A machine learning engineer is trying to scale a machine learning pipeline pipeline that contains
multiple feature engineering stages and a modeling stage. As part of the cross-validation process,
they are using the following code block: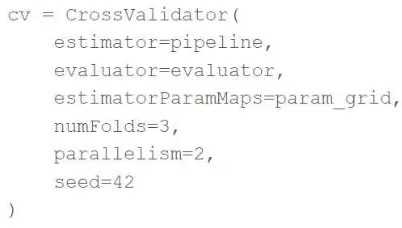
A colleague suggests that the code block can be changed to speed up the tuning process by passing
the model object to the estimator parameter and then placing the updated cv object as the final
stage of the pipeline in place of the original model.
Which of the following is a negative consequence of the approach suggested by the colleague?
- A. The model will take longer to train for each unique combination of hvperparameter values
- B. The feature engineering stages will be computed using validation data
- C. The cross-validation process will no longer be
- D. The cross-validation process will no longer be reproducible
- E. The model will be refit one more per cross-validation fold
Answer:
B
Explanation:
If the model object is passed to the estimator parameter of CrossValidator and the cross-validation
object itself is placed as a stage in the pipeline, the feature engineering stages within the pipeline
would be applied separately to each training and validation fold during cross-validation. This leads to
a significant issue: the feature engineering stages would be computed using validation data, thereby
leaking information from the validation set into the training process. This would potentially
invalidate the cross-validation results by giving an overly optimistic performance estimate.
Reference:
Cross-validation and Pipeline Integration in MLlib (Avoiding Data Leakage in Pipelines).
Question 11
What is the name of the method that transforms categorical features into a series of binary indicator
feature variables?
- A. Leave-one-out encoding
- B. Target encoding
- C. One-hot encoding
- D. Categorical
- E. String indexing
Answer:
C
Explanation:
The method that transforms categorical features into a series of binary indicator variables is known
as one-hot encoding. This technique converts each categorical value into a new binary column, which
is essential for models that require numerical input. One-hot encoding is widely used because it
helps to handle categorical data without introducing a false ordinal relationship among categories.
Reference:
Feature Engineering Techniques (One-Hot Encoding).
Question 12
A data scientist wants to parallelize the training of trees in a gradient boosted tree to speed up the
training process. A colleague suggests that parallelizing a boosted tree algorithm can be difficult.
Which of the following describes why?
- A. Gradient boosting is not a linear algebra-based algorithm which is required for parallelization
- B. Gradient boosting requires access to all data at once which cannot happen during parallelization.
- C. Gradient boosting calculates gradients in evaluation metrics using all cores which prevents parallelization.
- D. Gradient boosting is an iterative algorithm that requires information from the previous iteration to perform the next step.
Answer:
D
Explanation:
Gradient boosting is fundamentally an iterative algorithm where each new tree is built based on the
errors of the previous ones. This sequential dependency makes it difficult to parallelize the training
of trees in gradient boosting, as each step relies on the results from the preceding step.
Parallelization in this context would undermine the core methodology of the algorithm, which
depends on sequentially improving the model's performance with each iteration.
Reference:
Machine Learning Algorithms (Challenges with Parallelizing Gradient Boosting).
Gradient boosting is an ensemble learning technique that builds models in a sequential manner. Each
new model corrects the errors made by the previous ones. This sequential dependency means that
each iteration requires the results of the previous iteration to make corrections. Here is a step-by-
step explanation of why this makes parallelization challenging:
Sequential Nature: Gradient boosting builds one tree at a time. Each tree is trained to correct the
residual errors of the previous trees. This requires the model to complete one iteration before
starting the next.
Dependence on Previous Iterations: The gradient calculation at each step depends on the predictions
made by the previous models. Therefore, the model must wait until the previous tree has been fully
trained and evaluated before starting to train the next tree.
Difficulty in Parallelization: Because of this dependency, it is challenging to parallelize the training
process. Unlike algorithms that process data independently in each step (e.g., random forests),
gradient boosting cannot easily distribute the work across multiple processors or cores for
simultaneous execution.
This iterative and dependent nature of the gradient boosting process makes it difficult to parallelize
effectively.
Reference
Gradient Boosting Machine Learning Algorithm
Understanding Gradient Boosting Machines
Question 13
A data scientist wants to efficiently tune the hyperparameters of a scikit-learn model. They elect to
use the Hyperopt library's fmin operation to facilitate this process. Unfortunately, the final model is
not very accurate. The data scientist suspects that there is an issue with the objective_function being
passed as an argument to fmin.
They use the following code block to create the objective_function: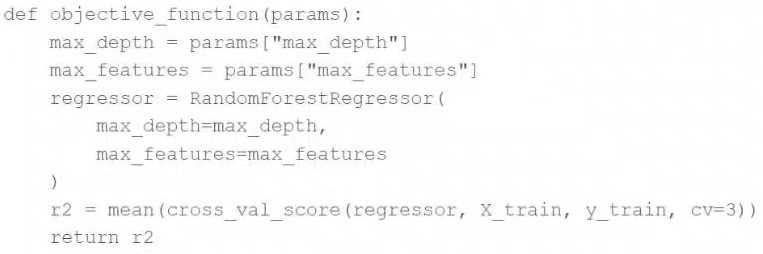
Which of the following changes does the data scientist need to make to their objective_function in
order to produce a more accurate model?
- A. Add test set validation process
- B. Add a random_state argument to the RandomForestRegressor operation
- C. Remove the mean operation that is wrapping the cross_val_score operation
- D. Replace the r2 return value with -r2
- E. Replace the fmin operation with the fmax operation
Answer:
D
Explanation:
When using the Hyperopt library with fmin, the goal is to find the minimum of the objective
function. Since you are using cross_val_score to calculate the R2 score which is a measure of the
proportion of the variance for a dependent variable that's explained by an independent variable(s) in
a regression model, higher values are better. However, fmin seeks to minimize the objective
function, so to align with fmin's goal, you should return the negative of the R2 score (-r2). This way,
by minimizing the negative R2, fmin is effectively maximizing the R2 score, which can lead to a more
accurate model.
Reference
Hyperopt Documentation: http://hyperopt.github.io/hyperopt/
Scikit-Learn documentation on model evaluation: https://scikit-learn.org/stable/modules/model_evaluation.html
Question 14
A data scientist is attempting to tune a logistic regression model logistic using scikit-learn. They want
to specify a search space for two hyperparameters and let the tuning process randomly select values
for each evaluation.
They attempt to run the following code block, but it does not accomplish the desired task: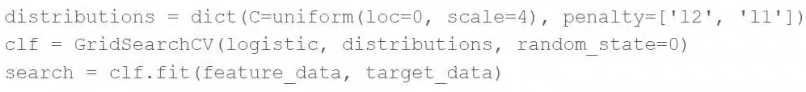
Which of the following changes can the data scientist make to accomplish the task?
- A. Replace the GridSearchCV operation with RandomizedSearchCV
- B. Replace the GridSearchCV operation with cross_validate
- C. Replace the GridSearchCV operation with ParameterGrid
- D. Replace the random_state=0 argument with random_state=1
- E. Replace the penalty= ['12', '11'] argument with penalty=uniform ('12', '11')
Answer:
A
Explanation:
The user wants to specify a search space for hyperparameters and let the tuning process randomly
select values. GridSearchCV systematically tries every combination of the provided hyperparameter
values, which can be computationally expensive and time-consuming. RandomizedSearchCV, on the
other hand, samples hyperparameters from a distribution for a fixed number of iterations. This
approach is usually faster and still can find very good parameters, especially when the search space is
large or includes distributions.
Reference
Scikit-Learn documentation on hyperparameter tuning: https://scikit-learn.org/stable/modules/grid_search.html#randomized-parameter-optimization
Question 15
Which of the following tools can be used to parallelize the hyperparameter tuning process for single-
node machine learning models using a Spark cluster?
- A. MLflow Experiment Tracking
- B. Spark ML
- D. Autoscaling clusters
- E. Delta Lake
Answer:
B
Explanation:
Spark ML (part of Apache Spark's MLlib) is designed to handle machine learning tasks across multiple
nodes in a cluster, effectively parallelizing tasks like hyperparameter tuning. It supports various
machine learning algorithms that can be optimized over a Spark cluster, making it suitable for
parallelizing hyperparameter tuning for single-node machine learning models when they are
adapted to run on Spark.
Reference
Apache Spark MLlib Guide:
https://spark.apache.org/docs/latest/ml-guide.html
Spark ML is a library within Apache Spark designed for scalable machine learning. It provides tools to
handle large-scale machine learning tasks, including parallelizing the hyperparameter tuning process
for single-node machine learning models using a Spark cluster. Here’s a detailed explanation of how
Spark ML can be used:
Hyperparameter Tuning with CrossValidator: Spark ML includes the CrossValidator and
TrainValidationSplit classes, which are used for hyperparameter tuning. These classes can evaluate
multiple sets of hyperparameters in parallel using a Spark cluster.
from pyspark.ml.tuning import CrossValidator, ParamGridBuilder
from pyspark.ml.evaluation import BinaryClassificationEvaluator
# Define the model
model = ...
# Create a parameter grid
paramGrid = ParamGridBuilder() \
.addGrid(model.hyperparam1, [value1, value2]) \
.addGrid(model.hyperparam2, [value3, value4]) \
.build()
# Define the evaluator
evaluator = BinaryClassificationEvaluator()
# Define the CrossValidator
crossval = CrossValidator(estimator=model,
estimatorParamMaps=paramGrid,
evaluator=evaluator,
numFolds=3)
Parallel Execution: Spark distributes the tasks of training models with different hyperparameters
across the cluster’s nodes. Each node processes a subset of the parameter grid, which allows
multiple models to be trained simultaneously.
Scalability: Spark ML leverages the distributed computing capabilities of Spark. This allows for
efficient processing of large datasets and training of models across many nodes, which speeds up the
hyperparameter tuning process significantly compared to single-node computations.
Reference
Apache Spark MLlib Documentation
Hyperparameter Tuning in Spark ML