comptia dy0-001 practice test
CompTIA DataX
Question 1
SIMULATION
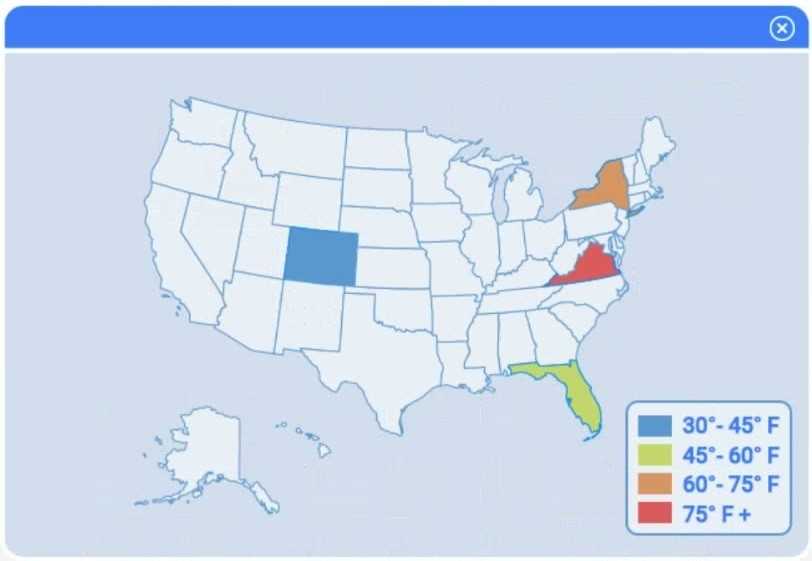
A client has gathered weather data on which regions have high temperatures. The client would like a
visualization to gain a better understanding of the data.
INSTRUCTIONS
Part 1
Review the charts provided and use the drop-down menu to select the most appropriate way to
standardize the data.
Part 2
Answer the questions to determine how to create one data set.
Part 3
Select the most appropriate visualization based on the data set that represents what the client is
looking for.
If at any time you would like to bring back the initial state of the simulation, please click the Reset All
button.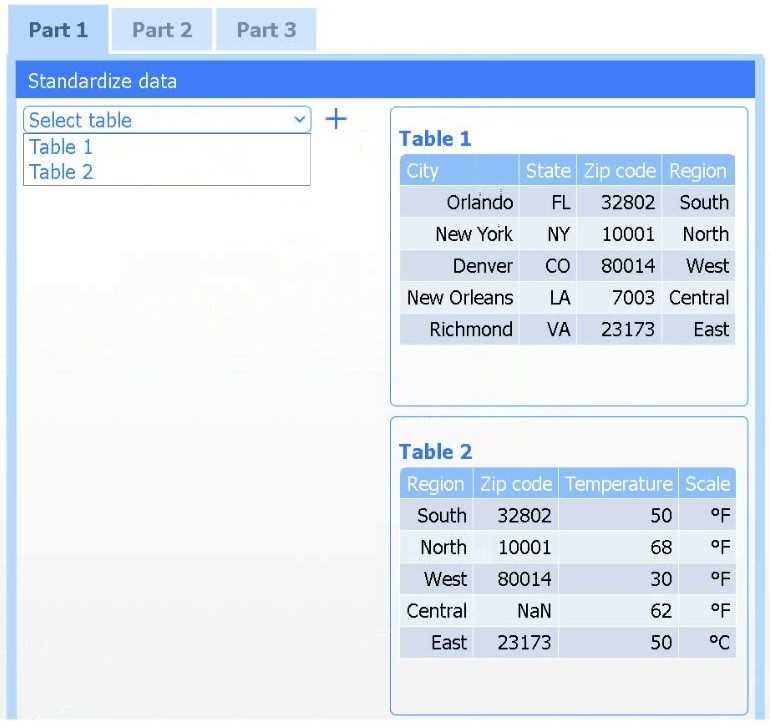


Answer:
See
explanation below.
Explanation:
Explanation:
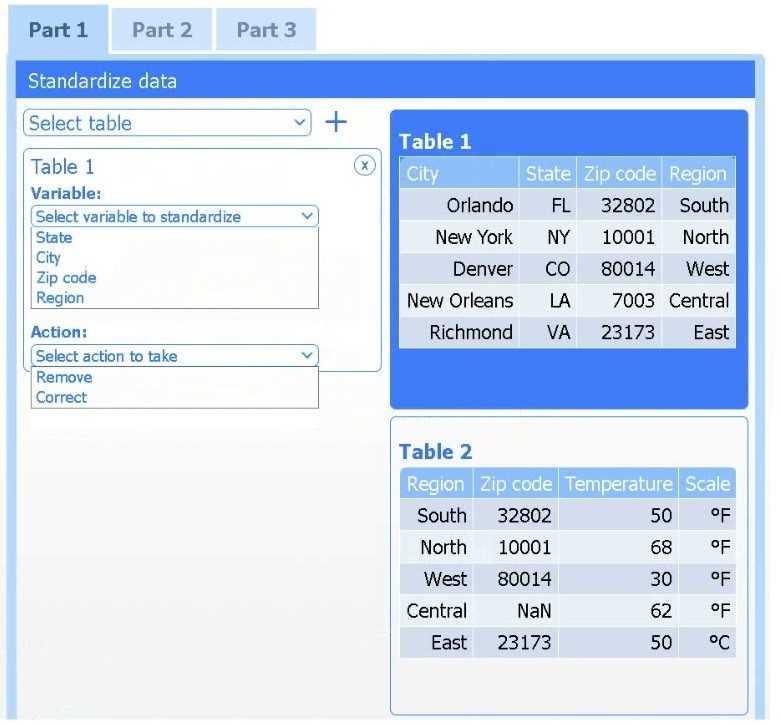
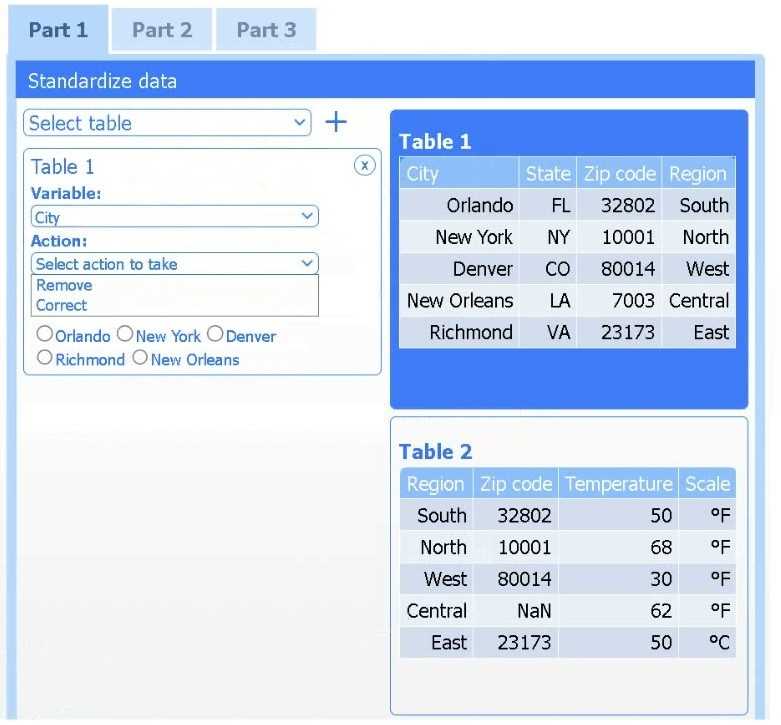
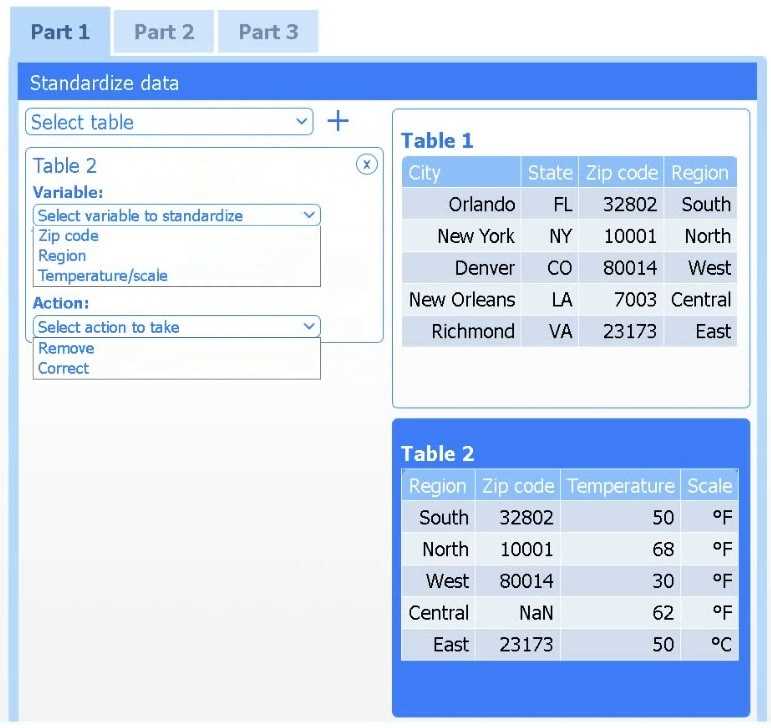
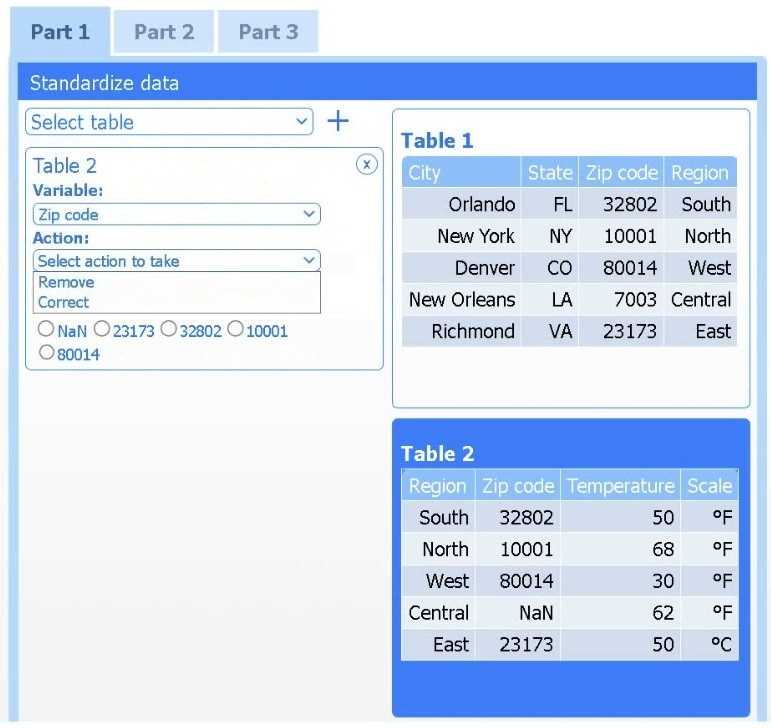
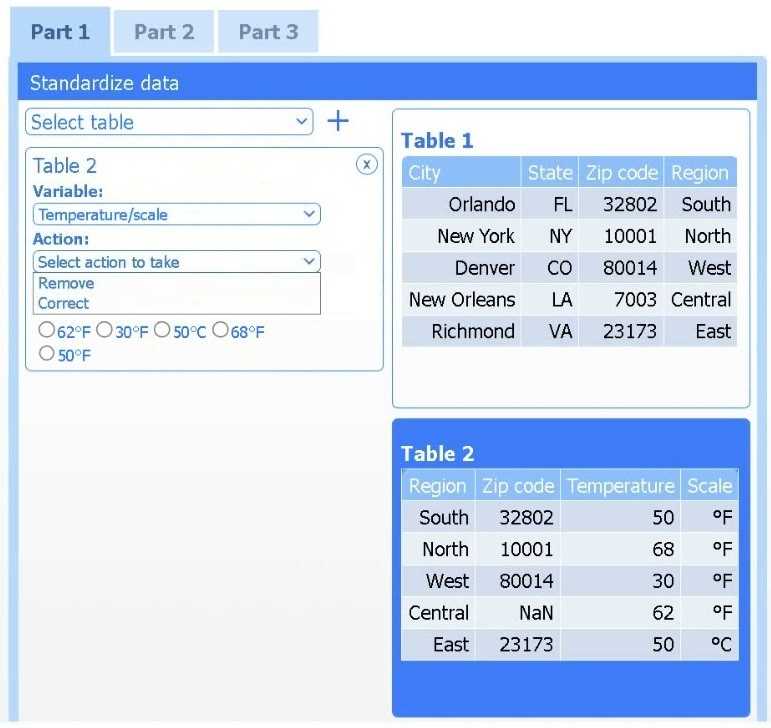
Part 1
Select Table 2. Table 2 contains mixed temperature scales (°F and °C) that must be standardized
before visualization.
Variable: Temperature/scale
Action: Correct
Value to correct: 50 °C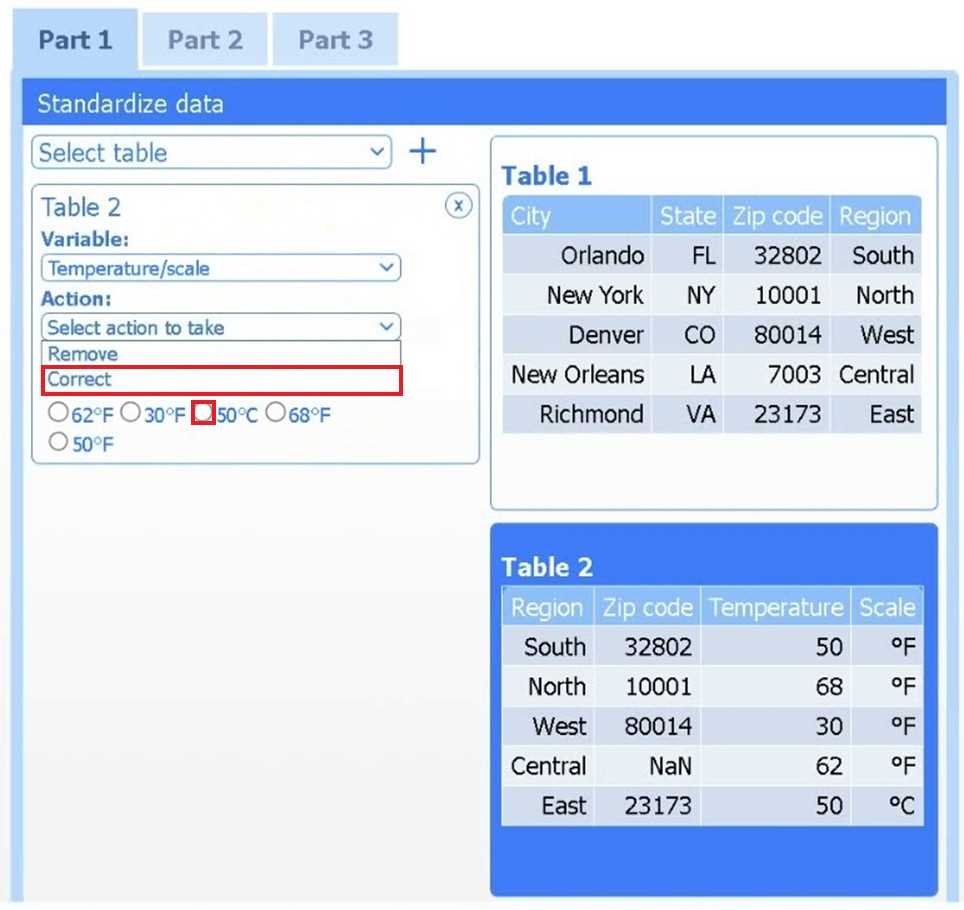
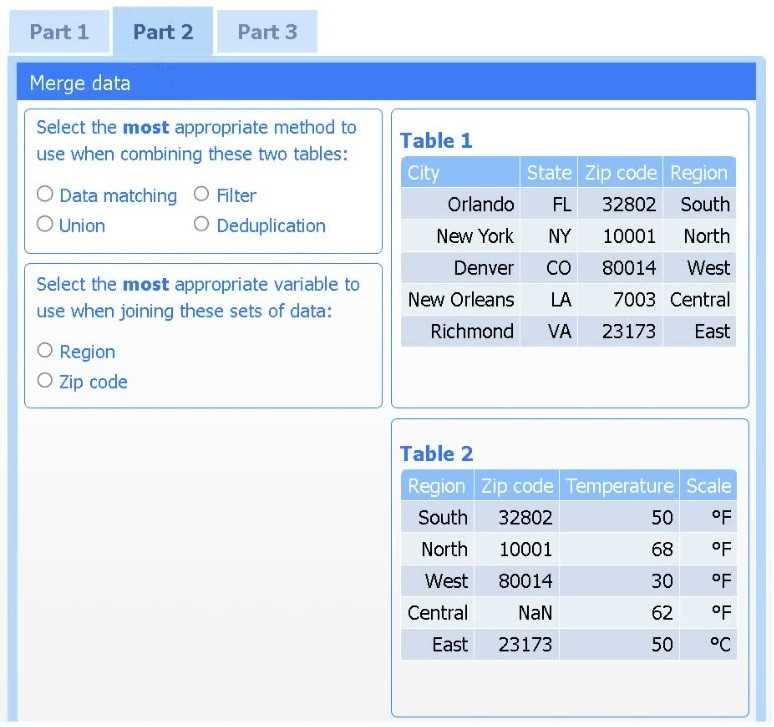
Part 2
Method: Data matching
Join variable: Zip code
You need to merge the two tables by aligning matching records, which is a data-matching (join)
operation, and ZIP code is the shared, uniquely identifying field linking each region’s weather
reading to its city.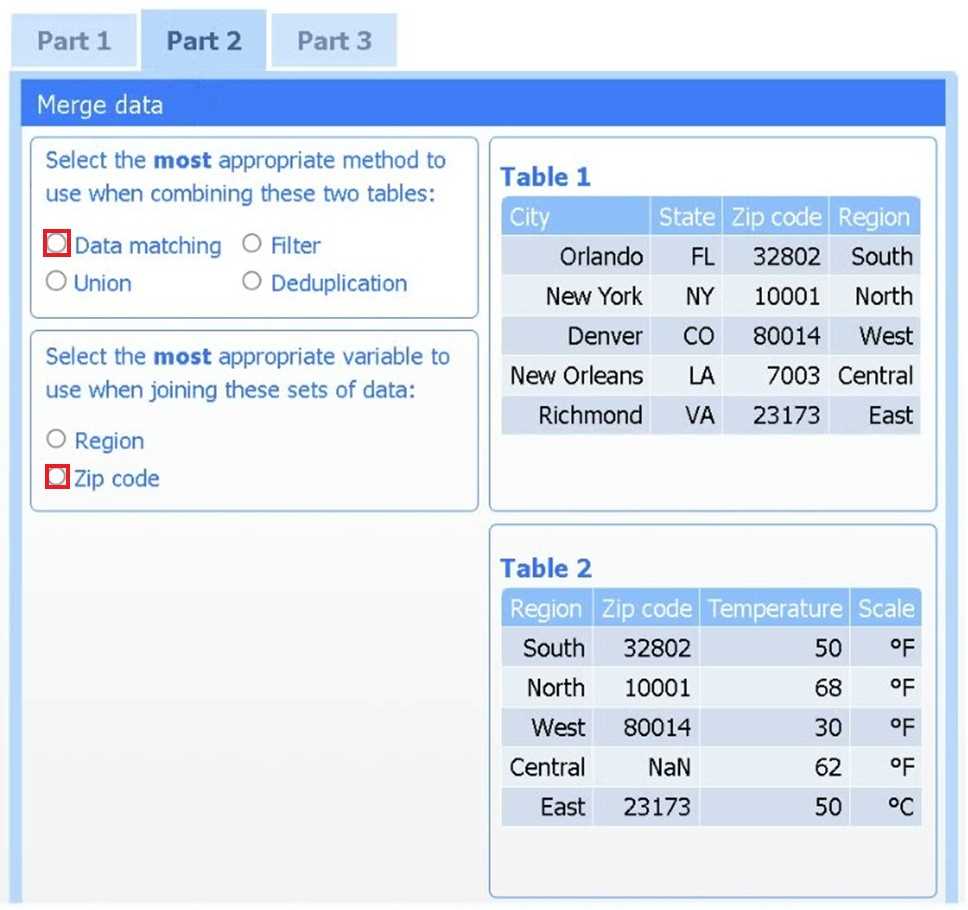
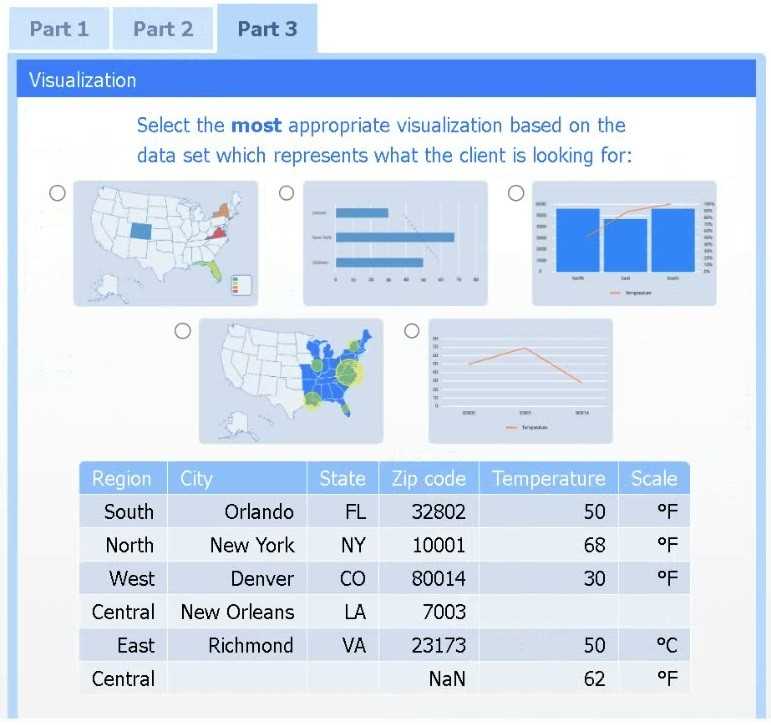
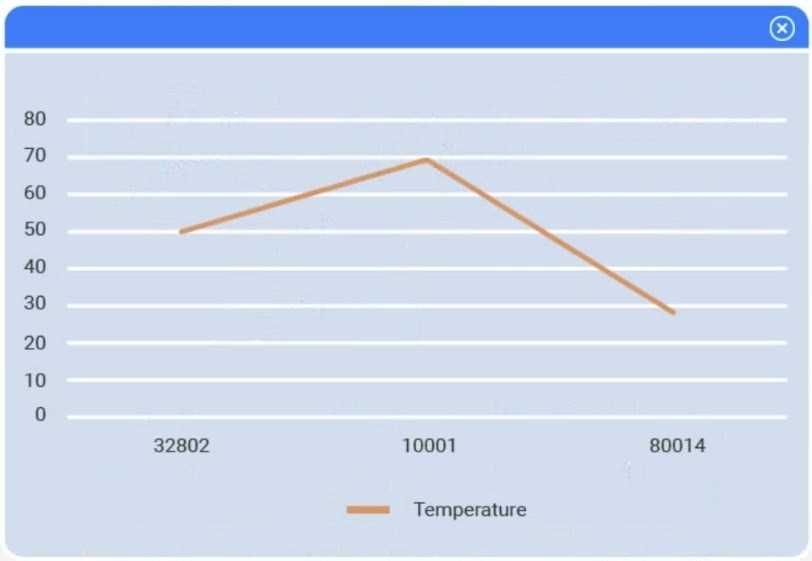
Part 3
Choose the choropleth map (the first option).
A choropleth map best shows geographic variation in temperature by coloring each state (or region)
according to its recorded value. This lets the client immediately see where the highest and lowest
temperatures occur across the U.S. without distracting elements like bubble size or combined chart
axes.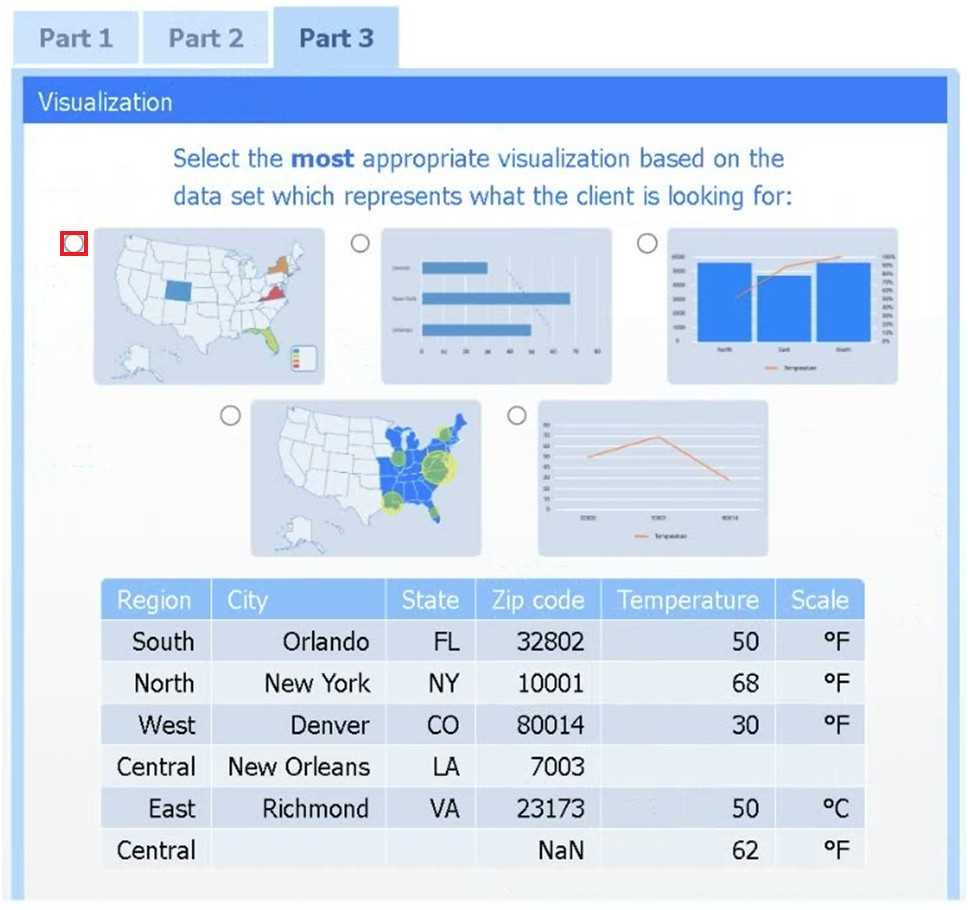
Question 2
SIMULATION
A data scientist needs to determine whether product sales are impacted by other contributing
factors. The client has provided the data scientist with sales and other variables in the data set.
The data scientist decides to test potential models that include other information.
INSTRUCTIONS
Part 1
Use the information provided in the table to select the appropriate regression model.
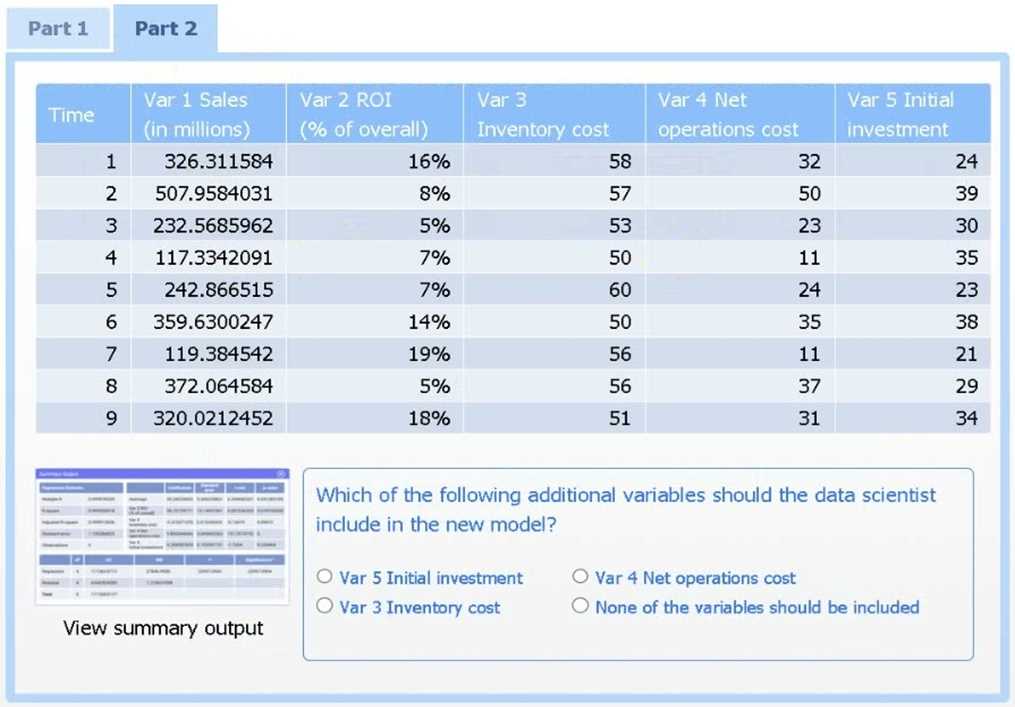
Part 2
Review the summary output and variable table to determine which variable is statistically significant.
If at any time you would like to bring back the initial state of the simulation, please click the Reset All
button.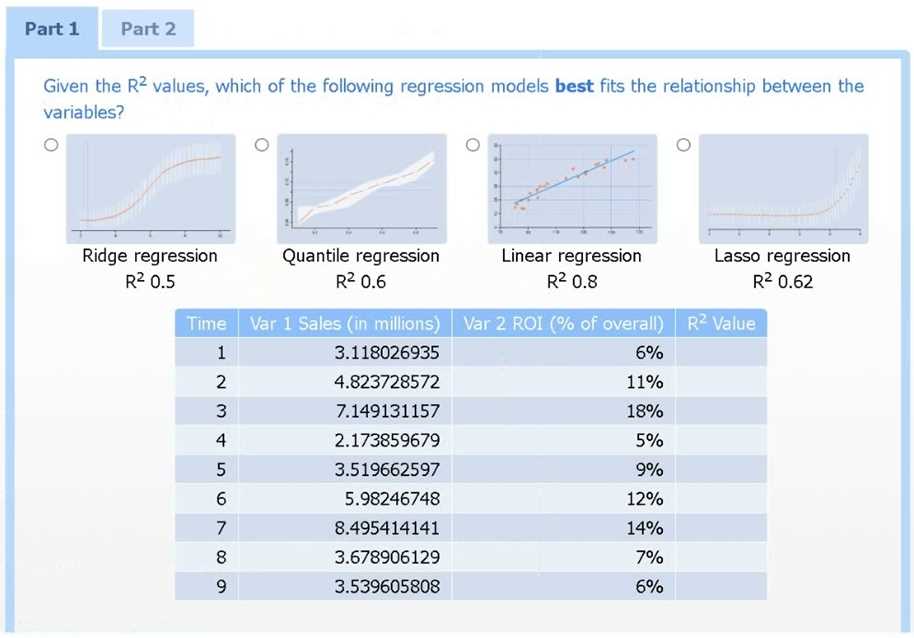
Answer:
See
explanation below.
Explanation:
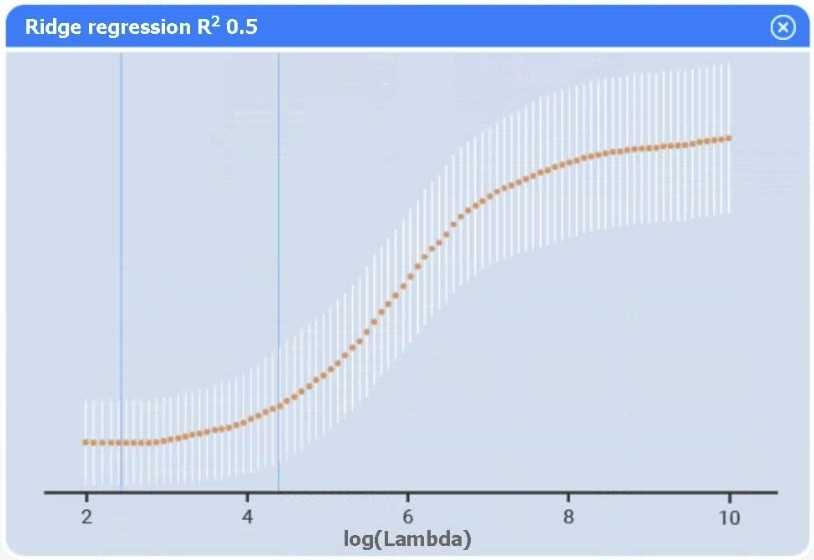
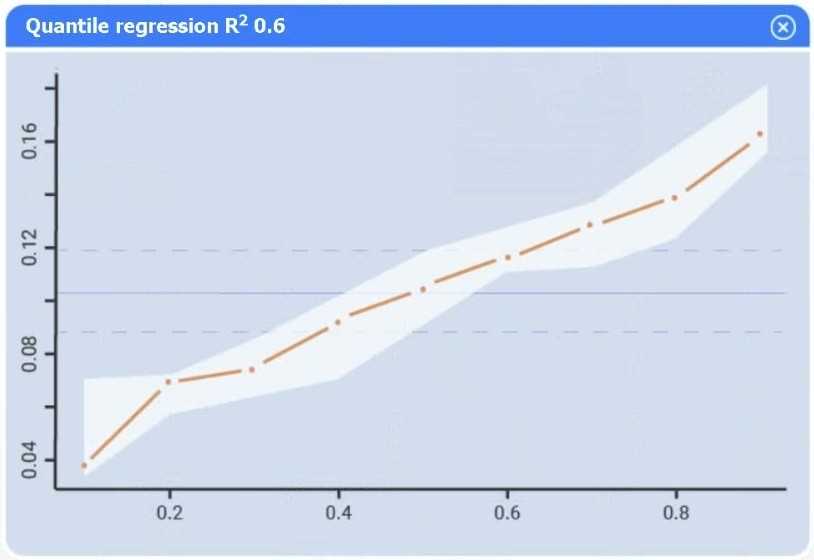
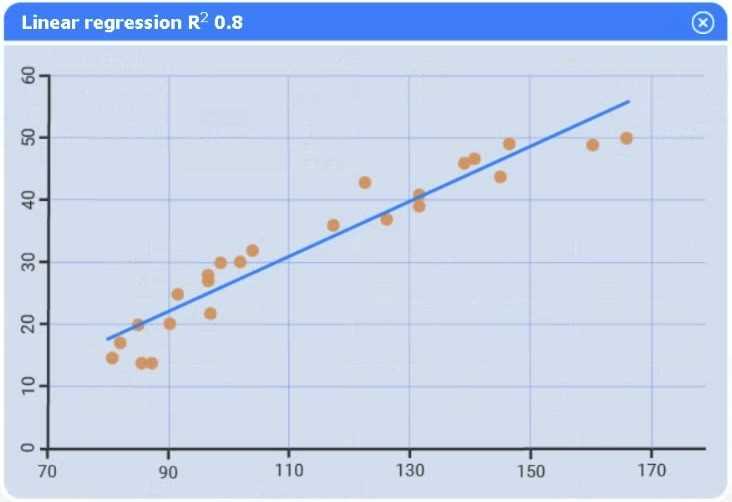
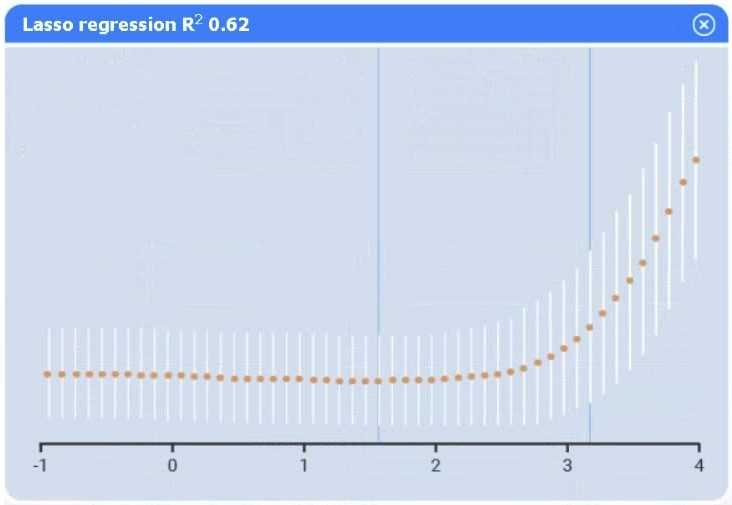
Part 1
Linear regression.
Of the four models, linear regression has the highest R² (0.8), indicating it explains the greatest
proportion of variance in sales.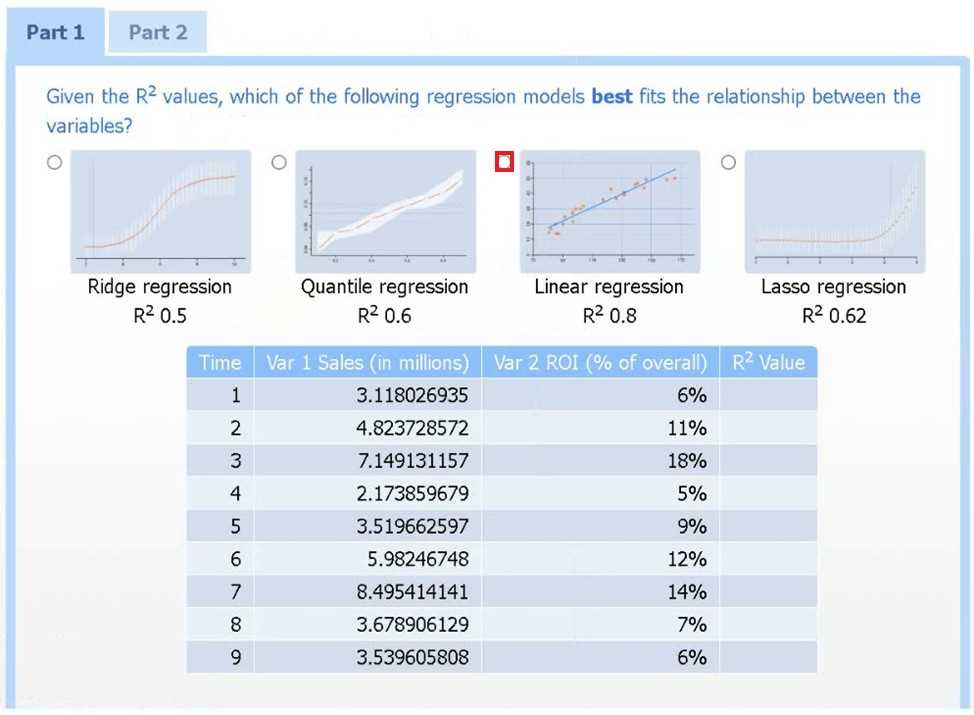
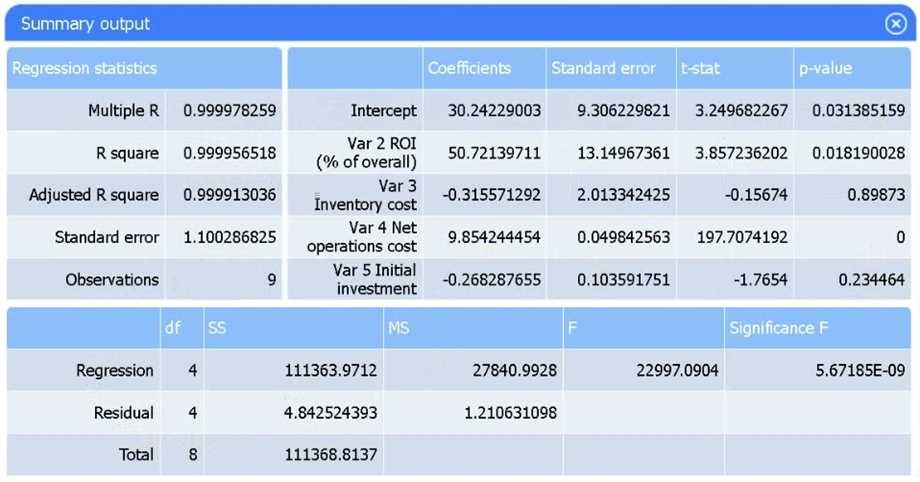
Part 2
Var 4 – Net operations cost.
Net operations cost has a p-value of essentially 0 (far below 0.05), indicating it is the only additional
predictor statistically significant in explaining sales. Neither inventory cost (p≈0.90) nor initial
investment (p≈0.23) reach significance.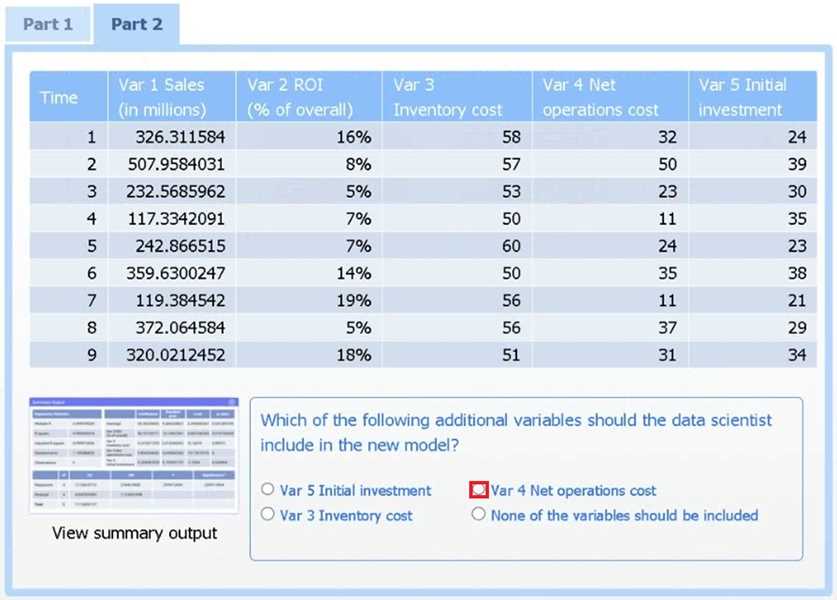
Question 3
A data scientist is building an inferential model with a single predictor variable. A scatter plot of the
independent variable against the real-number dependent variable shows a strong relationship
between them. The predictor variable is normally distributed with very few outliers. Which of the
following algorithms is the best fit for this model, given the data scientist wants the model to be
easily interpreted?
- A. A logistic regression
- B. An exponential regression
- C. A linear regression
- D. A probit regression
Answer:
C
Question 4
A data scientist wants to evaluate the performance of various nonlinear models. Which of the
following is best suited for this task?
- A. AIC
- B. Chi-squared test
- C. MCC
- D. ANOVA
Answer:
A
Question 5
Which of the following is the layer that is responsible for the depth in deep learning?
- A. Convolution
- B. Dropout
- C. Pooling
- D. Hidden
Answer:
D
Question 6
Which of the following modeling tools is appropriate for solving a scheduling problem?
- A. One-armed bandit
- B. Constrained optimization
- C. Decision tree
- D. Gradient descent
Answer:
B
Explanation:
Scheduling problems require finding the best allocation of resources subject to constraints (e.g., time
slots, resource availability), which is precisely what constrained optimization algorithms are designed
to handle.
Question 7
Which of the following environmental changes is most likely to resolve a memory constraint error
when running a complex model using distributed computing?
- A. Converting an on-premises deployment to a containerized deployment
- B. Migrating to a cloud deployment
- C. Moving model processing to an edge deployment
- D. Adding nodes to a cluster deployment
Answer:
D
Explanation:
Increasing the number of nodes in your cluster directly expands the total available memory across
the distributed system, alleviating memory-constraint errors without changing your code or
deployment paradigm. Containerization or edge deployments don’t inherently provide more
memory, and migrating to the cloud alone doesn’t guarantee additional nodes unless you explicitly
scale out.
Question 8
A data analyst wants to save a newly analyzed data set to a local storage option. The data set must
meet the following requirements:
Be minimal in size
Have the ability to be ingested quickly
Have the associated schema, including data types, stored with it
Which of the following file types is the best to use?
- A. JSON
- B. Parquet
- C. XML
- D. CSV
Answer:
B
Explanation:
Parquet is a columnar storage format that automatically includes schema (data types), uses efficient
compression to minimize file size, and enables very fast reads for analytic workloads.
Question 9
Which of the following is a key difference between KNN and k-means machine-learning techniques?
- A. KNN operates exclusively on continuous data, while k-means can work with both continuous and categorical data.
- B. KNN performs better with longitudinal data sets, while k-means performs better with survey data sets.
- C. KNN is used for finding centroids, while k-means is used for finding nearest neighbors.
- D. KNN is used for classification, while k-means is used for clustering.
Answer:
D
Explanation:
KNN is a supervised algorithm that assigns labels based on the closest labeled examples, whereas k-
means is an unsupervised method that partitions data into clusters by finding centroids without
using any pre-existing labels.
Question 10
A data scientist needs to:
Build a predictive model that gives the likelihood that a car will get a flat tire.
Provide a data set of cars that had flat tires and cars that did not.
All the cars in the data set had sensors taking weekly measurements of tire pressure similar to the
sensors that will be installed in the cars consumers drive. Which of the following is the most
immediate data concern?
- A. Granularity misalignment
- B. Multivariate outliers
- C. Insufficient domain expertise
- D. Lagged observations
Answer:
D
Explanation:
Because tire-pressure sensors report only weekly measurements, you risk missing the critical
pressure drop immediately preceding a flat. Those stale (“lagged”) readings may not reflect the
condition just before failure, undermining your model’s ability to learn the true precursors to a flat
tire.
Question 11
The term "greedy algorithms" refers to machine-learning algorithms that:
- A. update priors as more data is seen.
- B. examine even/ node of a tree before making a decision.
- C. apply a theoretical model to the distribution of the data.
- D. make the locally optimal decision.
Answer:
D
Explanation:
Greedy algorithms build the solution iteratively by choosing at each step the option that appears
best at that moment, without reconsidering earlier choices.
Question 12
A data scientist is deploying a model that needs to be accessed by multiple departments with
minimal development effort by the departments. Which of the following APIs would be best for the
data scientist to use?
- A. SOAP
- B. RPC
- C. JSON
- D. REST
Answer:
D
Explanation:
RESTful APIs use standard HTTP methods and lightweight data formats (typically JSON), making them
easy for diverse teams to integrate with minimal effort and without heavy tooling.
Question 13
Which of the following compute delivery models allows packaging of only critical dependencies
while developing a reusable asset?
- A. Thin clients
- B. Containers
- C. Virtual machines
- D. Edge devices
Answer:
B
Explanation:
Containers encapsulate just the application and its critical dependencies on a lightweight runtime,
making the resulting asset portable and reusable without bundling an entire operating system.
Question 14
A data analyst is analyzing data and would like to build conceptual associations. Which of the
following is the best way to accomplish this task?
- A. n-grams
- B. NER
- C. TF-IDF
- D. POS
Answer:
A
Explanation:
n-grams capture contiguous sequences of words, revealing which terms co-occur and form
meaningful multi-word concepts. By analyzing these frequent word combinations, you directly
uncover conceptual associations in the text.
Question 15
Which of the following belong in a presentation to the senior management team and/or C-suite
executives? (Choose two.)
- A. Full literature reviews
- B. Code snippets
- C. Final recommendations
- D. High-level results
- E. Detailed explanations of statistical tests
- F. Security keys and login information
Answer:
C
Explanation:
Senior leaders need actionable insights and the overarching outcomes, not the implementation
details, so you present your key recommendations alongside a summary of results at a high level.