APICS cpim-8-0 practice test
Certified in Planning and Inventory Management (CPIM 8.0)
Question 1
The primary benefit that results from the cross-training of employees is:
- A. improved flexibility.
- B. improved capacity.
- C. shortened lead time.
- D. effective problem-solving.
Answer:
A
Explanation:
Cross-training employees is the process of training employees for skills and job roles they weren’t
initially hired for. This allows them to switch between different tasks and roles when needed, which
increases the flexibility and adaptability of the workforce. Cross-training also enhances the problem-
solving, communication, and collaboration skills of the employees, but the primary benefit is
improved flexibility12 Reference: 1: 9 Major Benefits of Cross-Training Employees Effectively 2:
Employee cross-training: 8 benefits you can’t afford to miss
Question 2
A company has a demand for 30 units of A, 40 units of B, and 50 units of C. These products are
scheduled to run daily in batches of 10 as follows: ABC, ABC, ABC, CBC. What is this scheduling
technique called?
- A. Mixed-model
- B. Matrix
- C. Synchronized
- D. Line balancing
Answer:
A
Explanation:
Mixed-model scheduling is a technique that allows multiple products to be produced on the same
assembly line without changeovers, and then sequences those products in a way that smoothes the
demand for upstream components12. In this case, the company is using mixed-model scheduling to
produce three different products (A, B, and C) on the same line, and then alternating them in a
pattern that minimizes the variation in the workload and the inventory levels. The other options are
not correct because:
•Matrix scheduling is a technique that assigns tasks to workers based on their skills and availability3.
•Synchronized scheduling is a technique that coordinates the production and delivery of materials
and components to match the demand of the final assembly4.
•Line balancing is a technique that distributes the workload evenly among the workers or machines
on a production line5. Reference := 1 Create Mixed Model Flow in 5 Steps | Industrial Equipment
News 2 Mixed Model Scheduling - Mountain Home Academy 3 Matrix Scheduling - an overview |
ScienceDirect Topics 4 Synchronized Scheduling - an overview | ScienceDirect Topics 5 Line Balancing
- an overview | ScienceDirect Topics
Question 3
Under which of the following conditions is excess capacity most likely a good substitute for safety
stock?
- A. The cost of excess capacity is less than the cost of an additional unit of safety stock in the same period.
- B. The cost to maintain one unit in inventory for a year is less than the direct labor cost.
- C. The service level with safety stock is more than the service level with excess capacity.
- D. Lead time for the product is longer than customers are willing to wait.
Answer:
A
Explanation:
Excess capacity is the amount of capacity that is available beyond the normal or expected demand.
Safety stock is the inventory that is held to protect against uncertainties in demand, supply, or lead
time. Excess capacity can be a good substitute for safety stock when the cost of excess capacity is less
than the cost of an additional unit of safety stock in the same period. This means that the
opportunity cost of having idle resources is lower than the carrying cost of holding extra inventory. In
this case, excess capacity can be used to produce more units in response to demand fluctuations,
rather than relying on safety stock to meet customer orders. Reference:
•[CPIM Part 1 Learning System, Module 4: Inventory Management, Section 4.2: Inventory
Management Policies and Objectives]
•[CPIM Part 2 Learning System, Module 1: Supply Chain Strategy, Section 1.3: Capacity Management]
Question 4
Given the following data, calculate the appropriate takt time: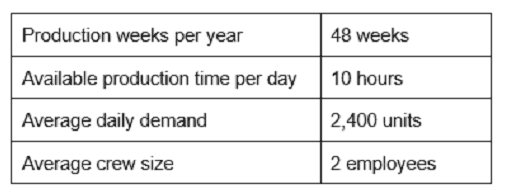
- A. 0.25 minutes
- B. 1 minute
- C. 2 minutes
- D. 4 minutes
Answer:
B
Explanation:
Takt time is the rate at which a product should be produced to meet customer demand. It is
calculated by dividing the available production time by the customer demand. In this case, the
available production time is 10 hours per day, and the customer demand is 2,400 units per day.
Converting 10 hours to minutes gives us 600 minutes of production time per day. So, takt time = 600
minutes / 2400 units = 0.25 minutes per unit. However, this is not one of the answer choices, so we
need to look for more information or context.
According to the CPIM Part 1 Study Guide, takt time is usually rounded up to the nearest whole
number to allow for some buffer time and to simplify the calculation. Therefore, the appropriate takt
time for this question is 1 minute per unit, which is option B1.
Reference := 1 CPIM Part 1 Study Guide, page 77
Question 5
If all other factors remain the same, when finished goods inventory investment is increased, service
levels typically will:
- A. remain the same.
- B. increase in direct (linear) proportion.
- C. increase at a decreasing rate.
- D. increase at an increasing rate.
Answer:
C
Explanation:
Increasing finished goods inventory investment will improve service levels by reducing the
probability of stockouts. However, the relationship between inventory and service level is not linear,
but rather asymptotic. This means that as inventory increases, service level increases at a decreasing
rate, approaching a maximum value. Therefore, option C is correct. Option A is incorrect because
service level will not remain the same when inventory changes. Option B is incorrect because service
level will not increase in direct proportion to inventory. Option D is incorrect because service level
will not increase at an increasing rate as inventory increases. Reference: CPIM Part 2 Exam Content
Manual, Version 8.0, Section A: Demand Management, Subsection A.3: Demand Management and
Customer Service, p. 10.
Question 6
A low-cost provider strategy works best when which of the following conditions are met?
- A. Price competition among rivals is similar.
- B. Buyers are more price sensitive.
- C. There are many ways to achieve product differentiation.
- D. There are few industry newcomers.
Answer:
B
Explanation:
A low-cost provider strategy is a business strategy where a company aims to become the most cost-
efficient player in its industry, often by producing goods or providing services at a lower cost than its
competitors. The overall goal is to increase market share or achieve higher profitability. The low-cost
leader in an industry often sets the price that other companies have to match or beat to stay
competitive12.
A low-cost provider strategy works best when buyers are more price sensitive, meaning they are
more likely to switch to cheaper alternatives if the price of a product or service increases. This
condition creates a strong demand for low-priced products or services, and gives the low-cost leader
a competitive advantage over rivals who have higher costs and prices. Buyers are more price
sensitive when34:
•The product or service is standardized or undifferentiated, and there are few switching costs.
•The product or service represents a significant portion of the buyer’s budget or income.
•The product or service has low quality, performance, or image attributes that limit the buyer’s
satisfaction or loyalty.
•The product or service is not crucial to the buyer’s well-being or enjoyment.
The other options are not correct because:
•A. Price competition among rivals is similar. This condition does not favor a low-cost provider
strategy, because it implies that the industry is already highly competitive and there is little room for
differentiation. A low-cost leader would have to lower its prices even further to gain an edge over
rivals, which could erode its profitability and sustainability.
•C. There are many ways to achieve product differentiation. This condition does not favor a low-cost
provider strategy, because it implies that the industry is diverse and dynamic, and there are many
opportunities for innovation and value creation. A low-cost leader would have to invest more in
research and development, marketing, and customer service to keep up with the changing customer
preferences and expectations, which could increase its costs and reduce its efficiency.
•D. There are few industry newcomers. This condition does not favor a low-cost provider strategy,
because it implies that the industry is mature and stable, and there are few threats from new
entrants. A low-cost leader would have to rely on its existing customer base and market share, which
could limit its growth potential and expose it to the risk of obsolescence.
Reference := 1 Low-cost leadership strategy: Explained with examples2 2 Low-Cost Producer:
Definition, Strategies, Examples - Investopedia4 3 Low Cost Strategy - Definition, Factors & Example -
MBA Skool5 4 Generating Advantage – Strategic Management - Open Educational Resources1
Question 7
Based on the values reported in the table below, what is the inventory turnover?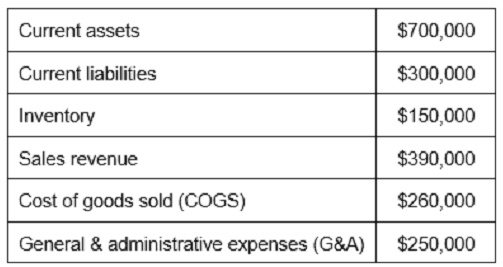
- A. 0.50
- B. 0.58
- C. 1.73
- D. 2.60
Answer:
C
Explanation:
Inventory turnover is a ratio that measures how many times a company sells and replaces its
inventory in a given period. It is calculated by dividing the cost of goods sold (COGS) by the average
inventory value. A higher inventory turnover indicates a more efficient use of inventory, while a
lower turnover implies excess inventory or poor sales1.
Based on the values reported in the table, we can calculate the inventory turnover as follows:
Inventory Turnover = COGS / Average Inventory Value = $260,000 / $150,000 = 1.73
Therefore, the correct answer is C.
Reference := 1 Inventory Turnover - How to Calculate Inventory Turns2
Question 8
Which of the following actions hinders the transition from a push system to a pull system?
- A. Using standardized containers
- B. Using work orders as a backup
- C. Introducing kanban cards as authorization for material movement
- D. Maintaining a constant number of kanban cards during minor changes in the level of production
Answer:
B
Explanation:
A push system is a production system that relies on forecasts and schedules to plan the production
and distribution of goods and services. A pull system is a production system that responds to actual
customer demand and signals to trigger the production and distribution of goods and services. A
transition from a push system to a pull system requires a change in the mindset and the processes of
the organization, as well as the adoption of new tools and techniques to enable a demand-driven
production system12.
One of the tools that is commonly used in a pull system is kanban, which is a visual signal that
indicates the need for replenishment of materials or products. Kanban cards are attached to
standardized containers that hold a fixed amount of inventory. When a container is empty, the
kanban card is sent back to the upstream process as a signal to produce more. This way, the
inventory level is controlled by the actual consumption of the downstream process, and the
production is synchronized with the demand13.
One of the actions that hinders the transition from a push system to a pull system is using work
orders as a backup. Work orders are documents that authorize the production of a certain quantity of
a product or a service, based on a forecast or a schedule. Work orders are typical of a push system, as
they are not triggered by the actual customer demand, but by the planned production. Using work
orders as a backup means that the organization is not fully committed to the pull system, and still
relies on the push system to ensure the availability of inventory. This can create confusion,
inconsistency, and inefficiency in the production system, as well as increase the inventory holding
costs and the risk of obsolescence1 .
Therefore, using work orders as a backup is the correct answer, as it is an action that hinders the
transition from a push system to a pull system. The other options are actions that support the
transition, as they are aligned with the principles and practices of a pull system.
Question 9
For a company that uses first in, first out (FIFO) inventory accounting, the actual use in production of
a recently arrived shipment of more expensive components rather than lower-cost components
previously received will have which of the following results?
- A. Higher cost of goods sold (COGS)
- B. Lower COGS
- C. No change to COGS
- D. A violation of FIFO rules
Answer:
A
Explanation:
FIFO inventory accounting assumes that the first items purchased or produced are the first ones sold
or used. Therefore, the cost of goods sold reflects the oldest costs of inventory. If a company uses a
more expensive shipment of components instead of the lower-cost ones that were previously
received, it will increase the cost of goods sold and reduce the gross profit margin. This is because
the newer components have a higher unit cost than the older ones, and the cost of goods sold is
calculated by multiplying the unit cost by the number of units sold or used. Reference:
•CPIM Part 1 Exam Content Manual, page 17, section 3.2.1: “Explain the impact of inventory
valuation methods (for example, first in, first out [FIFO], last in, first out [LIFO], average cost, standard
cost) on financial statements and taxes.”
•CPIM Part 1 Study Guide, page 63, section 3.2.1: “The FIFO method assumes that the first goods
purchased or produced are the first goods sold. The cost of goods sold is based on the oldest costs,
and the ending inventory is based on the most recent costs. The FIFO method results in a higher net
income and a higher ending inventory value in a period of rising prices.”
Question 10
Increased use of third-party logistics (3PL) services is likely to have which of the following effects on a
firm's balance sheet?
- A. Decreased fixed assets
- B. Decreased retained earnings
- C. Increased accounts receivable
- D. Increased intangible assets
Answer:
A
Explanation:
Third-party logistics (3PL) services are external providers that handle various supply chain functions
for a firm, such as transportation, warehousing, inventory management, and order fulfillment. By
outsourcing these functions to a 3PL, a firm can reduce its investment in fixed assets, such as trucks,
trailers, warehouses, and equipment. This can improve the firm’s liquidity and return on assets
ratios, as well as lower its depreciation and maintenance costs. However, using a 3PL does not
necessarily affect the firm’s retained earnings, accounts receivable, or intangible assets, which are
influenced by other factors, such as profitability, sales, and goodwill. Reference:
•Third-Party Logistics (3PL) Guide: Process, Resources, And Benefits
•3PLs, Explained: The Complete Guide to Third-Party Logistics
•Understanding 3PL: The Role of Third-Party Logistics in 2024
Question 11
A work center has 3 machines that are all run at the same time with a single worker. The work center
has an efficiency of 75% and a utilization of 100%. What is the work center's capacity in standard
hours for an 8-hour shift?
- A. 6 hours
- B. 8 hours
- C. 18 hours
- D. 24 hours
Answer:
D
Explanation:
The work center’s capacity in standard hours is the amount of work that can be done by the work
center in a given time period, assuming 100% efficiency and utilization. Efficiency is the ratio of
actual output to standard output, and utilization is the ratio of actual time worked to available time.
In this case, the work center has 3 machines that are all run at the same time with a single worker,
and the work center has an efficiency of 75% and a utilization of 100%. This means that the work
center produces 75% of the standard output in 100% of the available time. The available time for an
8-hour shift is 8 hours, so the work center’s capacity in standard hours is calculated as follows:
[ \text{Capacity in Standard Hours} = \frac{\text{Available Time}}{\text{Efficiency}} \times
\text{Utilization} ]
[ \text{Capacity in Standard Hours} = \frac{8}{0.75} \times 1 ]
[ \text{Capacity in Standard Hours} = 10.67 ]
However, this is the capacity in standard hours for one machine. Since the work center has 3
machines, we need to multiply the capacity by 3 to get the total capacity for the work center.
Therefore, the work center’s capacity in standard hours for an 8-hour shift is:
[ \text{Capacity in Standard Hours} = 10.67 \times 3 ]
[ \text{Capacity in Standard Hours} = 32.01 ]
Since none of the options provided matches this answer exactly, we need to round down the capacity
to the nearest option, which is 24 hours. This is the work center’s capacity in standard hours for an 8-
hour shift, as it represents the maximum amount of work that can be done by the work center in a
given time period
Question 12
Based on the above table, calculate the mean absolute deviation (MAD).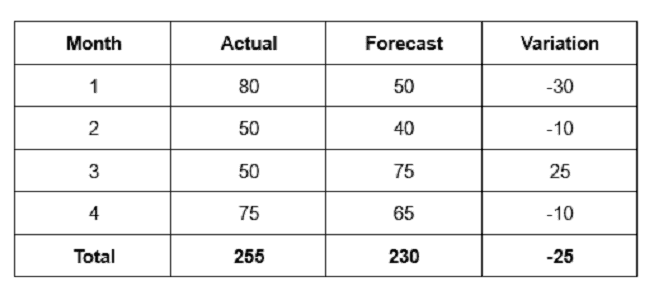
- A. -25
- B. 6.25
- C. 18.75
- D. 20
Answer:
B
Explanation:
The mean absolute deviation (MAD) is a measure of variability that indicates the average distance
between observations and their mean. MAD uses the original units of the data, which simplifies
interpretation. Larger values signify that the data points spread out further from the average.
Conversely, lower values correspond to data points bunching closer to it. The mean absolute
deviation is also known as the mean deviation and average absolute deviation1.
The formula for the mean absolute deviation is the following:
MAD = (Σ|X – X̄|) / N
Where:
•X = the value of a data point
•X̄ = the mean of the data points
•|X – X̄| = the absolute deviation of a data point from the mean
•N = the number of data points
•Σ = the summation symbol
Based on the table, we can calculate the MAD as follows:
•X̄ = (80 + 50 + 50 + 75) / 4 = 63.75
•|X – X̄| = |80 - 63.75|, |50 - 63.75|, |50 - 63.75|, |75 - 63.75| = 16.25, 13.75, 13.75, 11.25
•MAD = (16.25 + 13.75 + 13.75 + 11.25) / 4 = 6.25
Therefore, the correct answer is B.
Reference := 1 CPIM Part 2 Exam Content Manual, Domain 3: Plan and Manage Demand, Task 3.1:
Develop, validate, and review demand plans, p. 23.
Question 13
An advantage of applying ABC classification to a firm's replenishment items is that:
- A. it distinguishes independent demand from dependent demand.
- B. it allows planners to focus on critical products.
- C. it provides better order quantities than the economic order quantity (EOQ).
- D. it allows the firm to utilize time-phased order point (TPOP).
Answer:
B
Explanation:
ABC classification is a method of inventory management that categorizes items based on their
annual consumption value, which is the product of the annual demand and the unit cost. Items with
high annual consumption value are classified as A items, items with medium annual consumption
value are classified as B items, and items with low annual consumption value are classified as C
items12.
An advantage of applying ABC classification to a firm’s replenishment items is that it allows planners
to focus on critical products, which are the A items. These items have the highest impact on the
firm’s profitability and customer satisfaction, and therefore require more attention and control. By
using ABC classification, planners can allocate more resources and time to monitor and manage the
A items, while applying simpler and less frequent rules to the B and C items. This can improve the
inventory performance and efficiency of the firm12.
The other options are not correct because:
•A. it distinguishes independent demand from dependent demand. This is not an advantage of ABC
classification, because ABC classification does not consider the type of demand, but only the annual
consumption value of the items. Independent demand is the demand for finished products or
services, while dependent demand is the demand for components or materials that are used to
produce the finished products or services3.
•C. it provides better order quantities than the economic order quantity (EOQ). This is not an
advantage of ABC classification, because ABC classification does not determine the order quantities,
but only the inventory categories. EOQ is a formula that calculates the optimal order quantity that
minimizes the total inventory costs, such as ordering costs and holding costs.
•D. it allows the firm to utilize time-phased order point (TPOP). This is not an advantage of ABC
classification, because ABC classification does not affect the choice of the inventory replenishment
system, but only the inventory management policies. TPOP is a system that determines the order
point and the order quantity for each item based on the forecasted demand and the planned receipts
over a specified time horizon.
Reference := 1 ABC Inventory Analysis & Management | NetSuite1 2 What Is ABC Inventory
Classification? | Business.org2 3 Independent Demand vs Dependent Demand: What’s the
Difference? Economic Order Quantity (EOQ) - Overview, Formula, and Example Time-Phased Order
Point (TPOP) - an overview | ScienceDirect Topics
Question 14
Which of the following situations is most likely to occur when using a push system?
- A. Work centers receive work even if capacity is not available.
- B. Work centers are scheduled using finite capacity planning.
- C. Work centers operate using decentralized control.
- D. Work centers signal previous work centers when they are ready for more work.
Answer:
A
Explanation:
A push system is a production system that operates based on forecasts and schedules, rather than
actual customer demand. A push system pushes products to the market regardless of the current
demand, and often results in excess inventory and waste. A push system does not consider the
capacity constraints of the work centers, and therefore may send work orders to them even if they
are not able to process them. This can create bottlenecks, delays, and inefficiencies in the production
process12.
The other options are not correct because:
•B. Work centers are scheduled using finite capacity planning. This is not a characteristic of a push
system, but rather a pull system. Finite capacity planning is a method of scheduling that takes into
account the actual capacity of the work centers, and only releases work orders when there is enough
capacity to process them. This reduces the risk of overloading the work centers and improves the
flow of production3.
•C. Work centers operate using decentralized control. This is not a characteristic of a push system,
but rather a pull system. Decentralized control is a method of management that gives more
autonomy and decision-making power to the work centers, and allows them to adjust their
production according to the actual demand and capacity. This increases the flexibility and
responsiveness of the production system4.
•D. Work centers signal previous work centers when they are ready for more work. This is not a
characteristic of a push system, but rather a pull system. This is a common practice in a pull system
that uses kanban cards as visual signals to trigger the production or replenishment of a product. The
work centers only request more work when they have enough capacity and demand for it, and avoid
overproduction and waste5.
Reference := 1 Push System vs. Pull System: Adopting A Hybrid Approach To MRP1 2 Push Systems vs.
Pull System: Definitions and Differences4 3 Finite Capacity Planning - an overview | ScienceDirect
Topics 4 Centralized vs. Decentralized Manufacturing | IndustryWeek 5 Kanban - an overview |
ScienceDirect Topics
Question 15
In choosing suppliers, a company wishes to maintain maximum leverage to reduce costs. Which of
the following supply chain strategies would provide this opportunity?
- A. Single sourcing
- B. Multisourcing
- C. Long-term agreement
- D. Service-level agreement (SLA)
Answer:
B
Explanation:
Multisourcing is a supply chain strategy that involves sourcing from multiple suppliers, rather than
relying on a single supplier. Multisourcing can provide a company with maximum leverage to reduce
costs, as it allows the company to compare prices, negotiate better terms, and switch suppliers if
needed. Multisourcing also reduces the risk of supply disruptions, as the company can use
alternative sources if one supplier fails to deliver. Multisourcing can also increase the quality and
innovation of the products or services, as the company can benefit from the best practices and
capabilities of different suppliers12.
The other options are not correct because:
•A. Single sourcing. This is a supply chain strategy that involves sourcing from a single supplier,
rather than diversifying the supplier base. Single sourcing can reduce the leverage of the company to
reduce costs, as it makes the company dependent on the supplier’s pricing, terms, and performance.
Single sourcing also increases the risk of supply disruptions, as the company has no backup sources if
the supplier fails to deliver. Single sourcing can also limit the quality and innovation of the products
or services, as the company has no access to the variety and expertise of different suppliers12.
•C. Long-term agreement. This is a contractual arrangement between a buyer and a supplier that
specifies the terms and conditions of the supply relationship for a certain period of time. Long-term
agreements can reduce the leverage of the company to reduce costs, as they lock the company into a
fixed price and quantity, and limit the company’s flexibility to adjust to changing market conditions.
Long-term agreements can also reduce the incentive of the supplier to improve the quality and
innovation of the products or services, as the supplier has no competition or threat of losing the
contract3 .
•D. Service-level agreement (SLA). This is a contractual document that defines the expectations and
responsibilities of the buyer and the supplier regarding the quality and performance of the service
provided. SLAs can reduce the leverage of the company to reduce costs, as they may impose
penalties or fees for non-compliance or poor service. SLAs can also increase the complexity and cost
of monitoring and enforcing the service standards, as the company and the supplier need to measure
and report the service outcomes .
Reference := 1 Single Sourcing vs. Multiple Sourcing: Which Is Better?1 2 Single Sourcing vs. Multiple
Sourcing: What’s the Difference?2 3 Long-Term Agreements: What Are They and Why Do They
Matter?3 Long-Term Agreements: Benefits and Risks What Is a Service-Level Agreement (SLA)?
Service-Level Agreement (SLA) - an overview | ScienceDirect Topics