Adobe ad0-e208 practice test
Adobe Analytics Business Practitioner Expert
Question 1
A business owner is reviewing quarterly financial data and looks to complete projections for the
upcoming quarter.
Which tool should be used to enable this analysis?
- A. Adobe Experience Platform
- B. Data Feed
- C. Marketing Channels
Answer:
A
Explanation:
Adobe Experience Platform is a tool that enables data integration, analysis, and visualization across
different sources and channels. It can help business owners to review historical data and create
projections for the future.
References:
https://experienceleague.adobe.com/docs/experience-platform/landing/home.html?lang=en
Question 2
In the Solution Design Reference document, variable 'Product Category" is assigned to "eVar4" and is
set on a product page with value "Shoes". It is then not recorded in the shopping cart page, the
"Order summary" page, or the "Order completion" pages.
The variable is configured like this: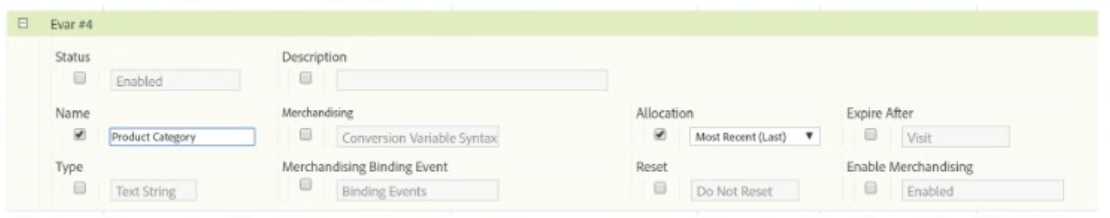
If we count the number of orders per product category in a report, which value receives one order
after one visitor completes a purchase from that Product page?
- A. Order completion
- B. Shoes
- C. None
Answer:
B
Explanation:
Since eVar4 is set to expire after purchase event, the value “Shoes” will be persisted throughout the
visit until the order is completed. Therefore, the report will show one order for product category
“Shoes”.
References: https://experienceleague.adobe.com/docs/analytics/components/variables/conversion-variables/conversion-var-overview.html?lang=en#expiration
Question 3
A UI/UX manager is concerned that a recent change in the design of a landing page may be confusing
to visitors.
Which two variables would be used to evaluate the impact of the design change on site traffic to that
landing page? (Choose two.)
- A. Bounce Rate
- B. Time Spent on Page
- C. Visitors
- D. Entries
Answer:
A, B
Explanation:
Bounce rate and time spent on page are two metrics that can indicate how engaging and user-
friendly a landing page is. A high bounce rate means that visitors are leaving the site after viewing
only one page, which may suggest that the page is not relevant or appealing to them. A low time
spent on page means that visitors are not spending enough time to explore the content or take
action on the page, which may also imply that the page is confusing or uninteresting.
References:
https://experienceleague.adobe.com/docs/analytics/components/metrics/bounce-
rate.html?lang=en https://experienceleague.adobe.com/docs/analytics/components/metrics/time-spent.html?lang=en
Question 4
Refer to the exhibit.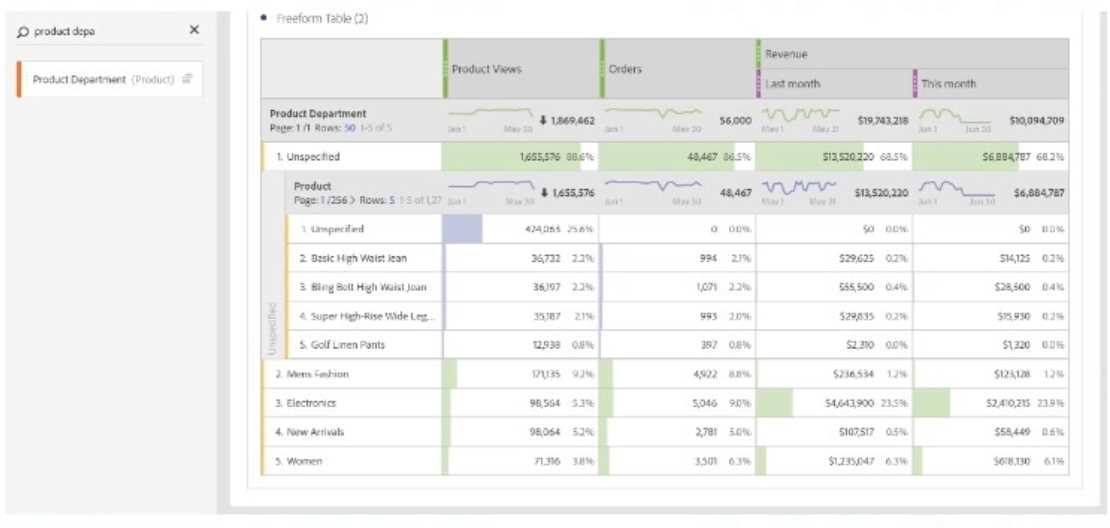
Analyzing results from multinational e-commerce, a data analyst realizes much of the product view
results and orders are being mapped to an "Unspecified" department name.
What is the probable cause?
- A. Product Department is a classification of product data. These products are not correctly updated or defined in classifications.
- B. Product View is not the proper metric for Product Department, thus causing the appearance of ® "Unspecified".
- C. Not all products will have a defined name and department. The "Unspecified" is an expected behavior.
Answer:
A
Explanation:
Product Department is a classification of product data that can be used to group products into
meaningful categories. If some products are showing up as “Unspecified” in the report, it means that
they are not correctly classified or updated in the classification file.
References:
https://experienceleague.adobe.com/docs/analytics/components/classifications/classifications-overview.html?lang=en
Question 5
Exhibit.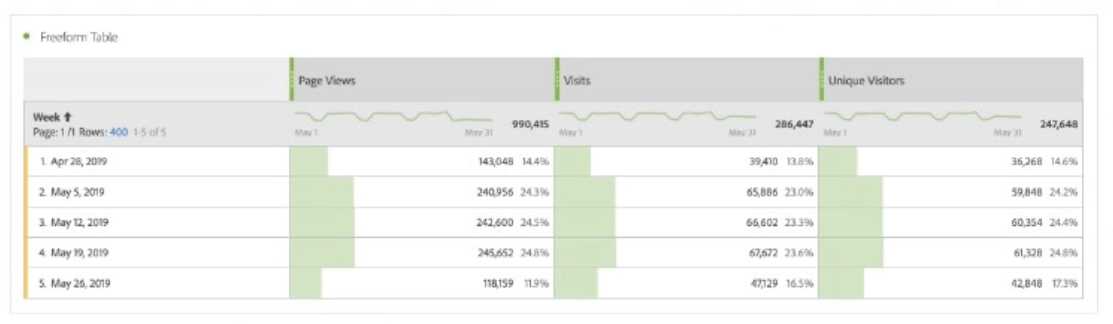
A business stakeholder receives a Workspace report that indicates that data is incorrect. The sums of
the items in the rows do not match the total metric values of the columns in the unique visitors and
visits report.
Which statement about the report is true?
- A. The total row in the table does not represent the sum of all the values in the table for unique ® visitors and visits.
- B. The report includes data from April, and this inflates the totals.
- C. There is a filter applied, and totals are not updated when filters are applied.
Answer:
A
Explanation:
Unique visitors and visits are de-duplicated metrics, which means that they do not add up linearly
across dimensions. For example, if a visitor visits two pages in one visit, the total number of unique
visitors and visits for those two pages is still one, not two. Therefore, the total row in the table shows
the actual number of unique visitors and visits for the whole site, not the sum of the values in the
table.
References:
https://experienceleague.adobe.com/docs/analytics/components/metrics/unique-visitors.html?lang=en
https://experienceleague.adobe.com/docs/analytics/components/metrics/visits.html?lang=en
Question 6
The Solution Design Reference (SDR) document states that the expiration setting for eVarl 1 is
"never" and the allocation is Most Recent (Last).
What happens to the persisted value when there is a new value collected for eVar11?
- A. The new and old values are collected separately.
- B. The old value is overwritten.
- C. The old value is not overwritten.
Answer:
B
Explanation:
Since eVar11 has the allocation setting of Most Recent (Last), it means that it will always capture the
last value that was set for that variable in a visit. Therefore, if there is a new value collected for
eVar11, it will overwrite the old value that was previously persisted.
References: https://experienceleague.adobe.com/docs/analytics/components/variables/conversion-variables/conversion-var-overview.html?lang=en#allocation
Question 7
In which two visualizations is the Anomaly Detection report available? (Choose two.)
- A. Ranked Freeform Table
- B. Line Visualization by Day
- C. Trended Freeform Table
- D. Line Visualization by Week
Answer:
B, D
Explanation:
Anomaly Detection is a feature that automatically detects statistical anomalies in your data based on
a daily or weekly granularity. Therefore, it is only available in line visualizations by day or by week,
not in ranked or trended freeform tables.
References:
https://experienceleague.adobe.com/docs/analytics/analyze/analysis-workspace/visualizations/line-visualization.html?lang=en#anomaly-detection
https://experienceleague.adobe.com/docs/analytics/analyze/analysis-workspace/predictive-analytics/anomaly-detection.html?lang=en
Question 8
Which is a benefit of using a Virtual Report Suite?
- A. Business users in your organization always see only the segmented data that is relevant to them.
- B. It provides the ability to freely customize variable allocation settings and variable names per Virtual Report Suite.
- C. Real-time reporting allows users to respond to trends within minutes of data collection.
Answer:
A
Explanation:
A Virtual Report Suite is a subset of data from an existing report suite that is based on a segment. It
allows business users to see only the data that is relevant to them without affecting the original
report suite data. It does not provide the ability to customize variable settings or names per Virtual
Report Suite, nor does it enable real-time reporting.
References:
https://experienceleague.adobe.com/docs/analytics/components/virtual-report-suites/vrs-overview.html?lang=en
https://experienceleague.adobe.com/docs/analytics/components/virtual-report-suites/vrs-faq.html?lang=en
Question 9
Analyzing the data in the image below, a data analyst verifies that the report of "entries" per page,
shows that the "HomePage A" page is responsible for only 3.4% of the total "entries" to the site: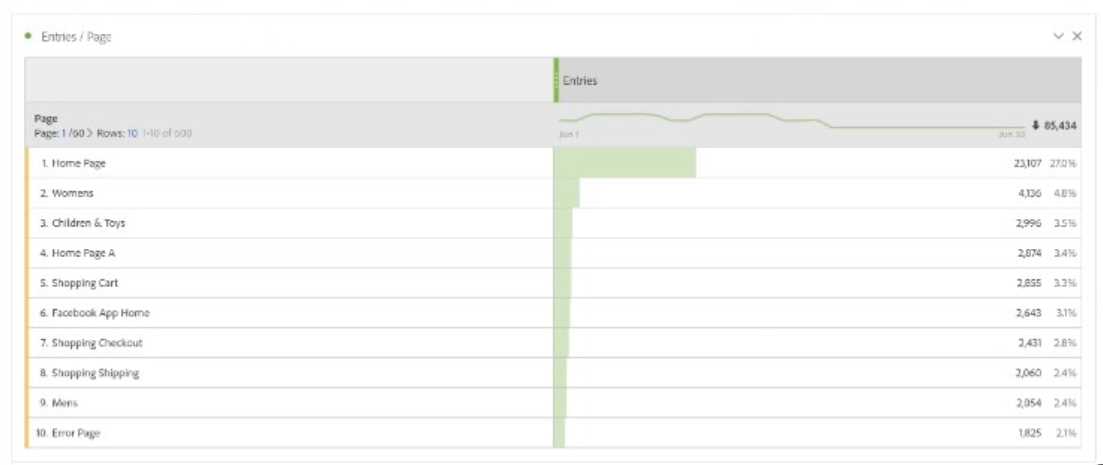
When comparing this information with the Occurrences per Entry Pages report below, it verifies that
the "Homepage A" page has 4.5% of the total Occurrences of the Entry Pages:
Based on both the images and knowledge on the standard metrics of Adobe Analytics, which
statement is correct?
- A. The Entries metric refers to entries on a given page, and is counted every time the page loads on a visit.
- B. The Entry Page Dimension refers exclusively to the first page that a visitor lands on the site on every visit, so there are distortions regarding the period of analysis.
- C. Occurrences refers to all hits associated with a particular entry page, also counting events triggered throughout the session.
Answer:
C
Explanation:
Occurrences is a metric that counts every hit where a dimension value is set, including page views
and events. Therefore, if an entry page has more occurrences than entries, it means that visitors who
entered through that page also triggered other events during their session. Entries is a metric that
counts only the first hit of a visit where a dimension value is set, such as an entry page.
References:
https://experienceleague.adobe.com/docs/analytics/components/metrics/occurrences.html?lang=e
n https://experienceleague.adobe.com/docs/analytics/components/metrics/entries.html?lang=en
Question 10
A spike in traffic is observed for a specific day. Knowing that there are no campaigns running, the first
hypothesis is that this is bot traffic.
Which Adobe Analytics tool may be used to identify the IP of the user that contributes to this spike in
traffic without using a custom variable?
- A. Data Warehouse
- B. Anomaly Detection
- C. Analysis Workspace
Answer:
A
Explanation:
Data Warehouse is a tool that allows you to run custom queries on raw data and export the results to
various formats. It can also provide the IP address of the user as a dimension, which can help identify
bot traffic without using a custom variable.
References:
https://experienceleague.adobe.com/docs/analytics/export/data-warehouse/data-warehouse.html?lang=en
https://experienceleague.adobe.com/docs/analytics/components/dimensions/ip-address.html?lang=en
Question 11
When changing the Fallout visualization from Eventual Path to Next Hit, the analyst notices that the
data reports zero Visitors across the report.
Why would this occur?
- A. Across all visitors, the fallout depicted never was completed as a next step conversion.
- B. Across all visitors, the fallout depicted never was completed as an eventual path conversion.
- C. There was no direct path from the second and third fallout touchpoints.
Answer:
A
Explanation:
When changing the Fallout visualization from Eventual Path to Next Hit, the report shows only the
conversions that happened in the immediate next hit after each step. If the report shows zero visitors
across the report, it means that none of the visitors completed the fallout as a next step conversion.
References:
https://experienceleague.adobe.com/docs/analytics/analyze/analysis-workspace/visualizations/fallout.html?lang=en#next-hit-vs-eventual-path
Question 12
The conversion percentage from one step to another in a Fallout Visualization is 104%. What could
be the reason the percentage is over 100%?
- A. The success event can be fired outside of the specified funnel order.
- B. Success events cannot be added to a funnel.
- C. Another report suite's data is polluting the funnel.
Answer:
A
Explanation:
The Fallout visualization can show a conversion percentage over 100% if the success event can be
fired outside of the specified funnel order. For example, if a visitor completes a purchase before
viewing a product, the purchase event will still be counted in the fallout even though it happened
before the product view event.
References:
https://experienceleague.adobe.com/docs/analytics/analyze/analysis-workspace/visualizations/fallout.html?lang=en#over-100-percent-conversion
Question 13
A web analyst is viewing a report in an Analysis Workspace freeform table and sees a dark gray
triangle.
What is this specifying in the report?
- A. Data includes outside data source
- B. Incomplete data
- C. Data anomaly detected
Answer:
C
Explanation:
A dark gray triangle in a report indicates that a data anomaly has been detected for that data point. It
means that the value is significantly different from the expected range based on historical data and
seasonality.
References:
https://experienceleague.adobe.com/docs/analytics/analyze/analysis-workspace/predictive-analytics/anomaly-detection.html?lang=en#anomaly-detection-in-analysis-
workspace
Question 14
An analyst wants to use all of the following variables to configure a single fallout report:
• Landing page prop
• Marketing channel eVar
• Product view event
• Purchase event
• Product category eVar
Which tool should the analyst use?
- A. Segment builder
- B. Workspace
- C. Reports and analysis
Answer:
B
Explanation:
Workspace is a tool that allows you to create interactive and customizable reports using various
visualizations and components. It can also support multiple variables in a single fallout report, unlike
segment builder or reports and analysis.
References:
https://experienceleague.adobe.com/docs/analytics/analyze/analysis-workspace/analysis-workspace.html?lang=en
https://experienceleague.adobe.com/docs/analytics/analyze/analysis-workspace/visualizations/fallout.html?lang=en#creating-a-fallout-visualization
Question 15
Which option would an analyst choose to show the percentage change between the two numbers in
a visualization?
- A. Use the Summary Change visualization from a Freeform Table, click the Visualization settings, and O select Show Raw Difference
- B. Use the Summary Change visualization, click the Visualization settings, and select Show Percent ,#l Change
- C. Use the Summary Number visualization, click the Visualization settings, and select Percentages
Answer:
B
Explanation:
The Summary Change visualization shows the difference between two numbers in a report, such as
current period vs previous period. To show the percentage change between the two numbers, you
need to click the Visualization settings and select Show Percent Change.
References:
https://experienceleague.adobe.com/docs/analytics/analyze/analysis-workspace/visualizations/summary-change.html?lang=en